Kagi chart indicator
Many traders are constantly searching for additional tools that will help them cut through the so-called market noise in Forex.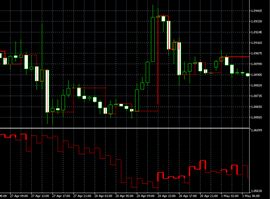
Indeed, the presence of market noise and constant sideways movements manage to confuse even experienced professionals.
The only sure way to eliminate this kind of noise is to decouple price movement from the time frame and base the chart on distance traveled rather than time frames.
The Kagi chart indicator is a technical analysis tool that allows you to separate price movements from time periods and create the famous Kagi chart based on past price ranges.
It is worth noting that the Kagi indicator is plotted both directly on the price chart and below it as a separate line.
Installing the Kagi chart indicator
The Kagi chart indicator is a custom development that was implemented in the new version of the popular trading platform, namely MT5.
Therefore, in order to use the indicator and independently construct this type of chart, you will need to download the tool file at the end of the article and then install it.
Installing an indicator in MT5 is almost identical to installing indicators in the familiar MT4, namely, you will need to copy the downloaded indicator file to the appropriate folder in the terminal's data directory.
To do this, launch the MT5 trading terminal and go to the "File" menu in the upper left corner. From the list of options that appears, find and select "Open Data Folder.".
After gaining access to the directory, you will see a list of the platform's system folders. Among them, find a folder called Indicators and drop the downloaded file of the Kagi chart indicator into it.
In order for the terminal to see the installed file, it will need to be restarted, after which the tool will appear in the navigator panel in the "Indicators" section.
In order for the indicator to appear on the chart, you need to drag the name of the instrument; only after updating the chart will the instrument be displayed correctly.
Brief history. Practical application of the indicator
Kagi charts were first created in 1878 to commemorate the opening of the Tokyo Stock Exchange.
However, Europeans and Americans, like us, were able to learn about this type of chart only at the end of 1994, when Steve Nison's famous book dedicated to candlestick analysis and this type of chart in particular was published.
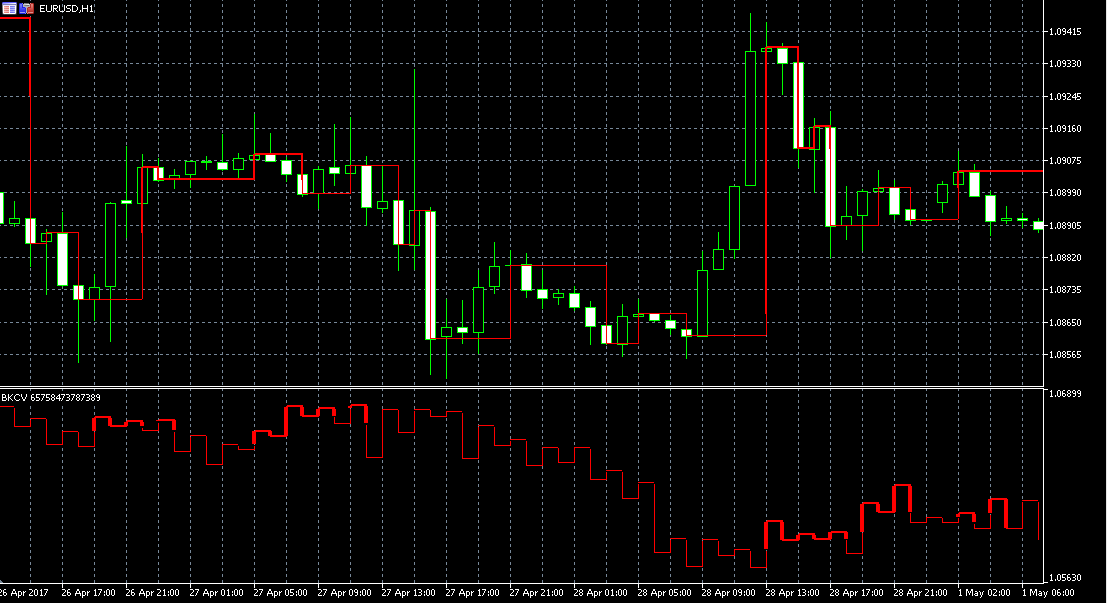
If you look at a Kagi chart, you'll see that it consists of broken lines of varying thickness. The thick line is called "Yang," and the thin line is called "Yin.".
It is worth noting that the thickness of the line changes at the moment when the price breaks through its formed highs and lows, which indicates the activation of the trend movement.
As already noted, the lines of the Kagi chart are not tied to a unit of time, but are tied to the distance in points or percentages that the price covers.
When it comes to practical application of this indicator, it's quite simple. If a thin rising line turns into a thick one, open a buy position, and if a wide falling line turns into a thin one, open a sell position.
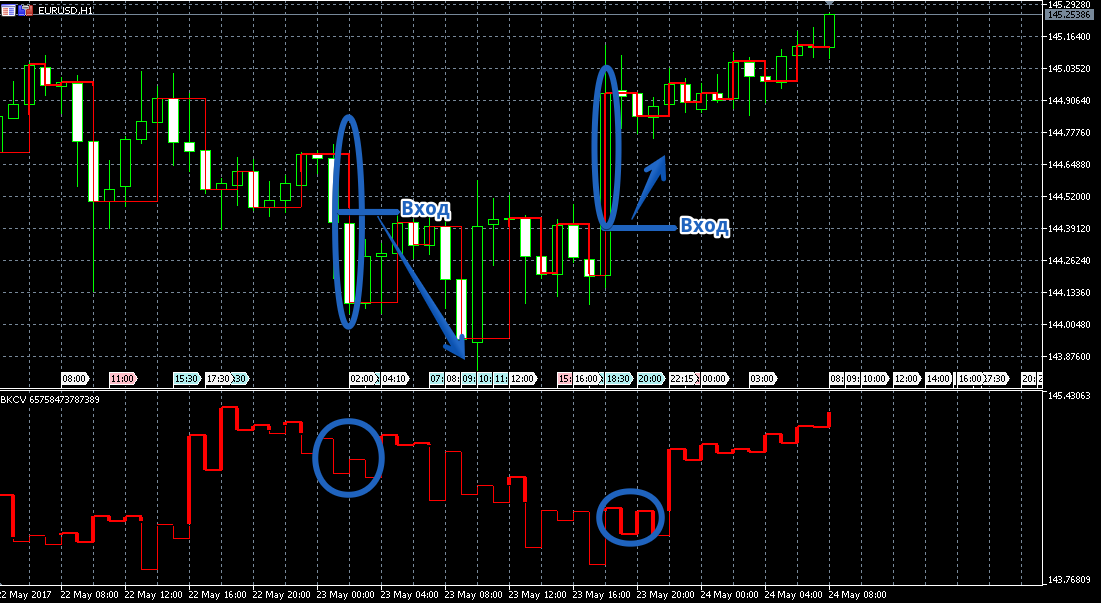
Also, on Kagi charts, just like on familiar price charts, you can draw trend lines, build channels, and open positions based on their breakout or rebound.
Kagi chart indicator settings
Using the indicator settings, you can see special price markers on the chart at the moment of line breaks, as well as directly influence the chart's construction and color scheme.
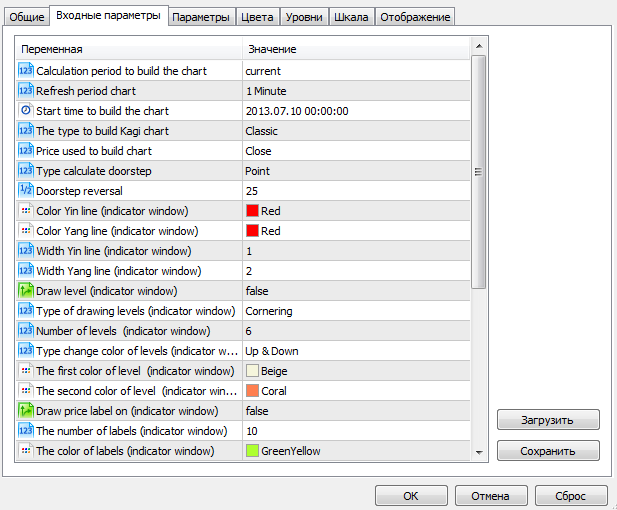
So in the kagi type line you can select the type of kagi chart construction, namely author's or classic.
The price type variable allows you to select the prices at which the plotting will occur, and in the doorstep line you can specify the distance in points for plotting the kagi chart.
The "levels on off" variable allows you to enable or disable the appearance of price labels at the moment of reversal. The "color yin" and "color yang" variables allow you to change the color of the thin and thick lines, and the "width yin" and "width yang" rows allow you to set the thickness of these lines.
In conclusion, it is worth noting that thanks to the Kagi indicator, you will not only be able to build a legendary chart, but also look at the market from a completely different angle, without intrusive market noise and flatA.
Download the Kagi Chart Indicator

