Oil Indicators: The Best Free Indicators for Oil Trading
The price of oil is constantly changing, sometimes fluctuating by thousands of points in a day, which opens up excellent trading opportunities in a volatile market.

Moreover, the best performance is demonstrated by a combination of news strategy and technical analysis indicators.
Oil is one of the most sensitive assets to geopolitics, reserves, and OPEC decisions, so movements are often impulsive. In such conditions, it's important not just to monitor the chart but to use tools that help filter out market noise.
This is why, when trading oil, indicators remain one of the key elements of successful trading, allowing you to find entry and exit points even during sharp price movements.
To make trading more efficient, you don't need to install additional scripts; it's best to use the tools already available in the MT4 and MT5 trading platforms.
| Indicator name |
Installed by default in: | Brief description |
|---|---|---|
| Moving Average | MetaTrader 4 / MetaTrader 5 | Smooths the price and shows the trend direction. Used to determine the overall market movement and signals at crossovers. |
| RSI | MetaTrader 4 / MetaTrader 5 | Identifies overbought and oversold zones. Helps spot reversals after strong price movements. |
| Bollinger Bands | MetaTrader 4 / MetaTrader 5 | Shows volatility boundaries. Used to find entry points when the price breaks out of the range. |
Indicator for determining the trend
Moving Average is a basic tool that shows the general direction of price movement.
It smooths out fluctuations and allows you to understand whether the market is moving up or down.
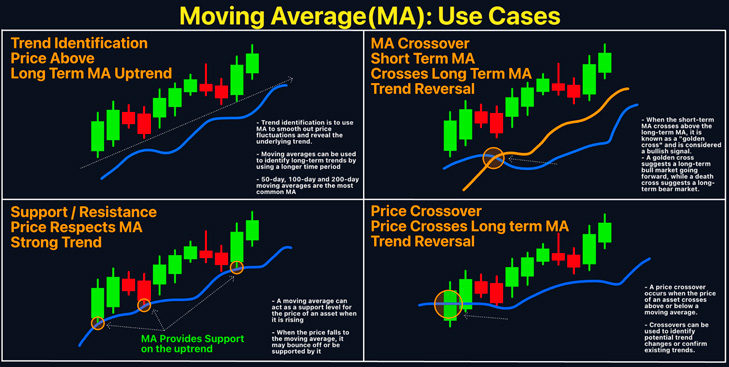
How to use: If the price is above the moving average, the trend is up; if it is below, the trend is down. You can also use the intersection of two moving averages (for example, 50 and 100), which provides more accurate signals.
For oil, it is better to choose medium periods, since the market moves faster than classic currency pairs.
RSI indicator for oil trading: finding reversals
RSI (Relative Strength Index) helps identify overbought and oversold zones.
This is especially true for oil, as strong impulses are often followed by sharp pullbacks.
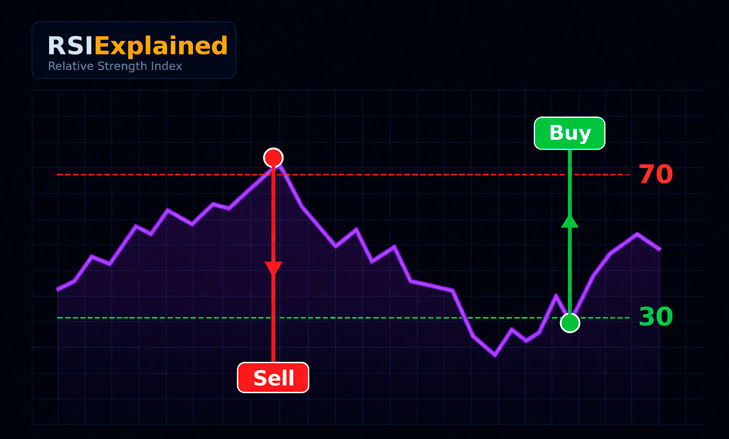
How to use: A reading above 70 signals possible overbought conditions, while a reading below 30 signals oversold conditions. Divergences between the price and the indicator also provide good signals.
RSI is best used in combination with news background and trending instruments.
Bollinger Bands: Finding Entry Points for Oil
Bollinger Bands show the range of current volatility and help find entry points.
Oil often breaks out of its range and then returns to the mean.
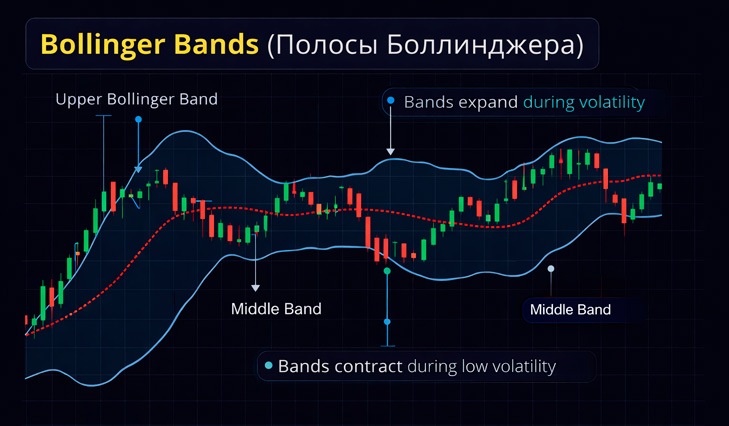
How to use: Touching the upper band may signal overbought conditions, while touching the lower band may signal oversold conditions. Narrowing bands often precede a strong move.
This tool is especially effective on intraday timeframes.
Oil trading indicators help systematize chaotic price movements and significantly improve trade entry accuracy. The most effective approach is a combination of trend-following tools and oscillators.
You can test these tools in practice with brokers with access to Brent and WTI:

