Cryptocurrency Heatmap for the MT5 Trading Platform
Financial markets are constantly changing, and traders need to quickly navigate the flow of information.
A market heat map is a tool that helps visualize price changes of various assets, such as stocks, currencies, commodities, and cryptocurrencies.
The map allows you to instantly see which assets are rising, which are falling, and which are remaining stable, helping to create a complete picture of what is happening in a particular market.
Unlike traditional price charts, the market map presents data in a color-coded scheme, where green typically signifies growth and red signifies decline. This significantly simplifies analysis and helps identify promising trading opportunities.
Today we'll explore a cryptocurrency heatmap built into the MetaTrader 5 trading platform, making it much more convenient to use than its online counterparts.
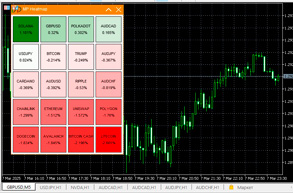
Cryptocurrency exchange rate heatmap in MT5
The MP Heatmap indicator provides a graphical representation of the relative strength of major cryptocurrencies against others by analyzing currency pair data and converting it into a color scheme.
This allows you to get a clear overview of the entire Forex market situation:
By installing a cryptocurrency heatmap, you gain the ability to monitor the cryptocurrency market situation and receive additional guidance when opening trades.
Another advantage is that this tool can be used on virtually any asset available on the trading platform. The indicator displays a specific number of assets from the Market Overview, although third-party assets can also be included in the map.
Indicator functions:
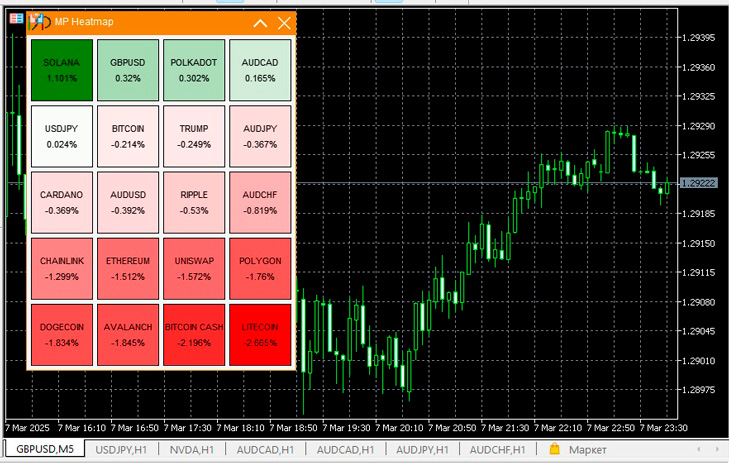
Graphical display of the currency market – the indicator builds a heat map for all or selected instruments from Market Watch.
Price Change Dynamics – shows the percentage change in the current price of an instrument relative to the previous day's closing price.
A clear market picture – the indicator helps you quickly assess the situation and identify strong and weak cryptocurrencies.
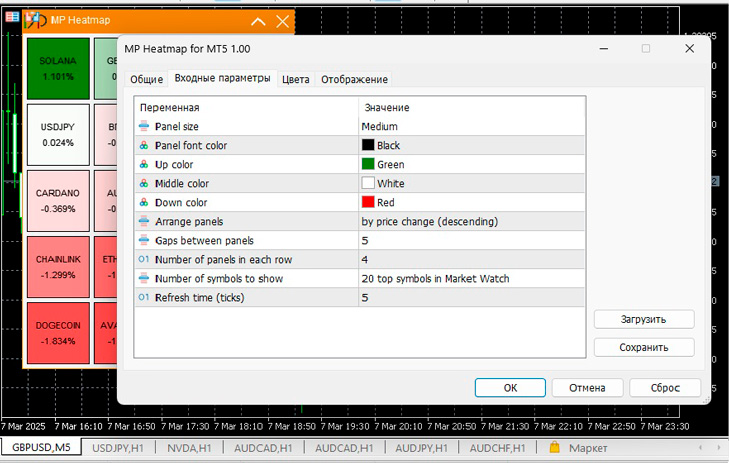
Indicator settings:
- Panel size (Small/Medium/Large) – determines the size of the block of each instrument on the heat map.
- Panel font color – the ability to select the color of the text on each panel.
- Up color – color for instruments with a positive percentage change.
- Middle color – color for tools without changes.
- Down color – color for instruments with negative percentage change.
- Sorting panels – you can sort blocks by price change, by symbol name, or in Market Watch order.
- Distance between panels (0–5 px) – adjusts the spacing between blocks.
- Number of panels per row (≥ 1) – sets the number of columns in the heat map.
- Number of displayed instruments (5/10/15/20/All) – allows you to select all instruments or only some from Market Watch.
- Update time (in ticks) – the frequency of data updates according to the selected number of ticks.
Additional features:
- The indicator window can be moved to any place on the chart.
- If necessary, the window can be minimized to avoid cluttering the screen.
- Displaying all instruments from Market Watch may increase the load on your computer.
The MP Heatmap indicator is a convenient cryptocurrency heatmap that allows you to quickly and effectively analyze market conditions, identify strong and weak assets, and make informed trading decisions.

