A universal indicator showing trend reversals across all assets
The best option for opening a trade is to enter the market immediately after a trend reversal; this moment can be determined by installing a reversal indicator on the chart.
But what if you want to trade multiple exchange assets at once and want to monitor the situation not only across multiple assets, but also across multiple timeframes?.
A universal trend reversal indicator, which can display reversal signals across 20 different assets, is suitable for these purposes.
The tool works great on currencies, cryptocurrencies, stocks, gold, and other assets. Simultaneous monitoring of up to six timeframes is available.
VSA Screener indicator showing trend reversals
After you've downloaded the VSA screener script and copied it to the MQL5\Experts\Market folder of your MetaTrader 5 all that's left to do is go to the settings:
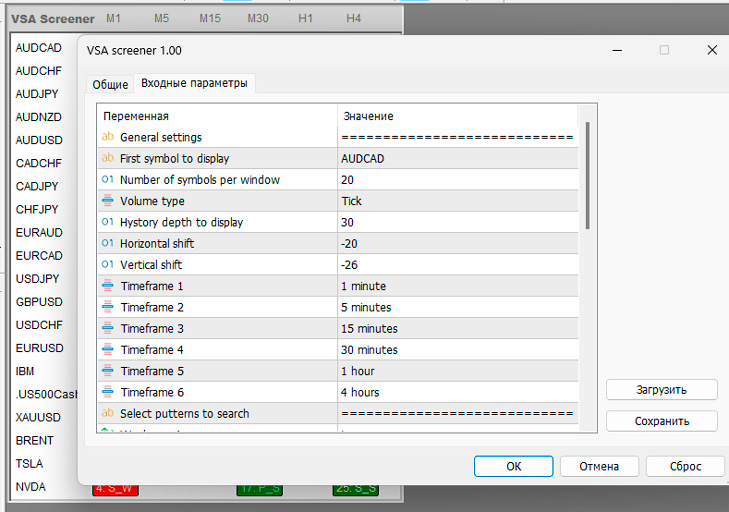
If we talk about the settings of this trend reversal indicator, there are several of them:
- Asset selection – you can enter manually selected assets or specify the first asset from the market overview, then the remaining assets will be displayed in half order as in the market overview.
- Number of characters – how many characters should be displayed in the informer.
- Volume type – tick or real. I only used tick volumes.
- Number of bars in the indicator window.
- Selecting timeframes on which to control the probability of a reversal.
- Pattern types to display.
VSA screener is based on Volume Spread Analysis (VSA) system, which analyzes the very essence of price movement (volume and price movement), warning of possible reversals.
How VSA Works (Briefly)
- Bar (candlestick or bar) + volume: The width (spread) of the price bar, the closing position and the corresponding volume are analyzed.
- Signals of supply and demand imbalance:
- High volume + narrow range → a sign of hidden activity by large participants.
- Low volume + wide range → signal of weak interest in the move.
- Accumulation and Distribution: VSA tries to identify phases when large players “fill the portfolio” with an asset (accumulation) or “dump” it (distribution).
- Entry Points: The trader looks for a “test” bar or “close of weakness” (no supply / no demand) to join the move on the smart money side.
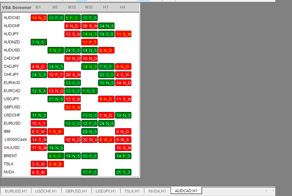
Once you add the reversal indicator to the chart, the chart will be filled with color, but an informer window will appear on it:
The tool is a dynamic table displaying all the key information needed to select a symbol for detailed analysis:
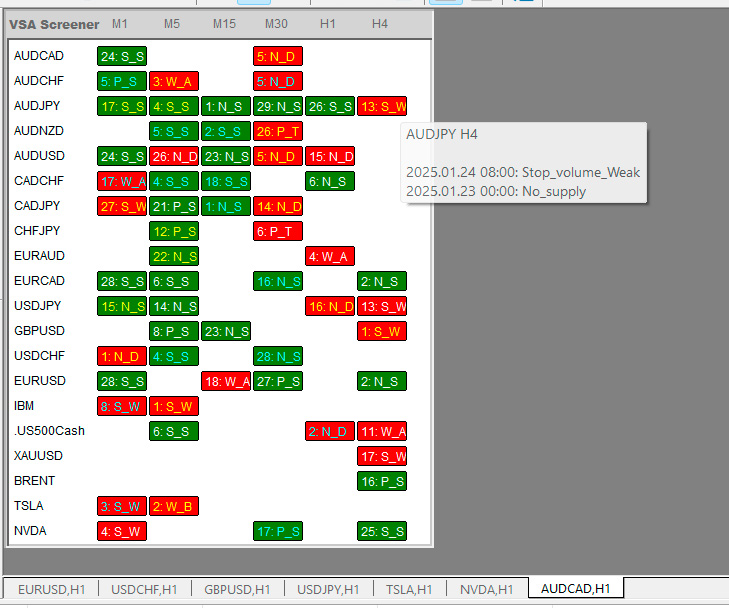
Availability of VSA pattern(s) with indication of the bar number (counting from the end, the current bar is zero)
Abbreviated display of the pattern name
Green or red color shows the strength and weakness of the pattern respectively
When you hover your mouse over a specific cell with an indication, a tooltip will appear indicating the last few patterns within the selected depth (20 last bars by default), as well as the time they appeared.
The color of the text in the indicator indicates the presence of one (white text) or multiple patterns at the selected history depth. Yellow indicates patterns in different directions, blue indicates patterns in the same direction, significantly increasing the likelihood of triggering a signal.
This configuration allows you to identify the most promising symbols for trading at a glance.
Available patterns and their abbreviated display:
Trend weakness signals (warn of the end of an uptrend and/or the beginning of a downtrend)
- Weakness A (W_A)
- Weakness B (W_B)
- No demand (N_D)
- Up thrust (U_T)
- Pseudo_up thrust (P_U)
- Stop Volume Weak (S_W)
Strong trend signals (warn of the end of a downtrend and/or the beginning of an uptrend)
- Strength_A (S_A)
- Strength B (S_B)
- No supply (N_S)
- Spring (S)
- Pseudo spring (P_S)
- Stop Volume Strong (S_S)
The VSA screener is a fully functional tool that allows you to easily identify an asset with a high probability of reversal.

