New "Moving Average" on moving averages
The Moving Average indicator is a classic tool for Forex trading; it has gained popularity for quite some time, and for good reason.
Many improved scripts have been created based on the standard version of this tool, one of which is presented in this article.
The script is based on the same principles; it works on moving averages just like the basic version, although now there are four of them.
And unlike the usual version of the script, the data display is now displayed in a separate window.
This allows you to get a comprehensive picture of price movements over your chosen timeframe, allowing you to simultaneously assess the situation across multiple timeframes.
It is based on the same Moving Average, so we can expect similar efficiency.
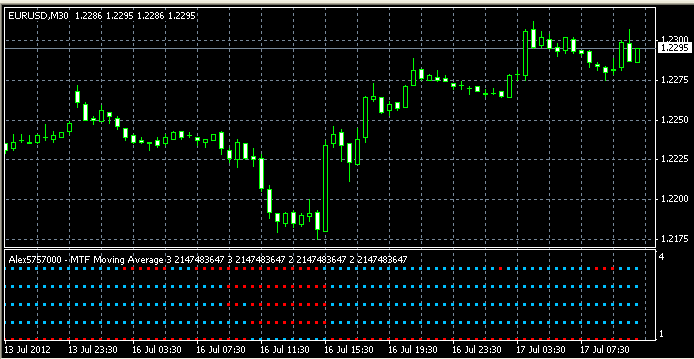
The Moving Average indicator displays several rows of multi-colored dots in the terminal window, red ones of which indicate a decrease in the price of a currency pair, and blue ones of which indicate an increase.
By looking at the resulting data, you can now immediately determine the current trend in the Forex market.
And by adding three more moving averages, you can not only assess the current situation but also track all existing trends.
Setting up a Moving Average
Due to the expanded capabilities, the indicator settings themselves have also been significantly expanded; if desired, you can customize each of the displayed lines.
A text file with a detailed description of all possible settings is located in the same archive as the program itself.
Trading.
As noted earlier, each moving average displays data for a different time period, so before you start trading, you should pre-configure the parameters to suit your needs.
Trading is quite simple.
Buy – all dots on the indicator change color and become blue, the deal is closed when red dots appear.
Sell – the indicator dots turn blue, the order is closed in the same way as in the previous case.
The picture looks pretty nice and clear, but you can only draw your own conclusions after testing the Moving Averages indicator on a real account.
To filter signals, it is advisable to install an additional trend indicator on the chart of the currency pair being traded.

