Indicator for determining the trend.
The indicator combines two functions: measuring the strength of an existing trend and forecasting it short-term. This means you  can not only assess the strength of the current trend but also see the expected continuation of the trend line.
The trend indicator is based on the popular Moving Average, meaning its calculations utilize the same Moving Average, a proven tool for analyzing historical price data.
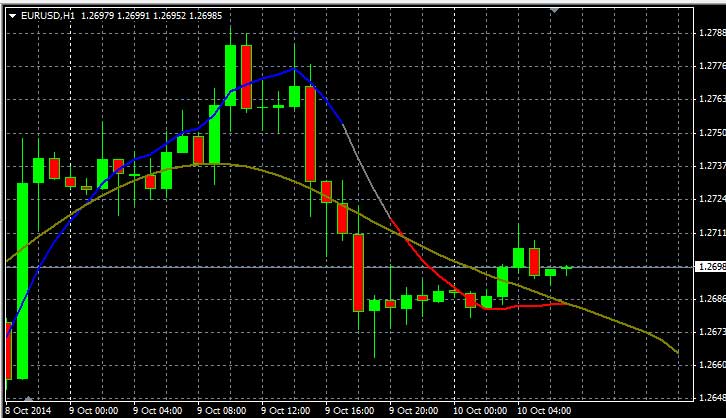
After you add the indicator to the desired chart, two lines will appear:
• The green line forecasts the trend and extends slightly further than the trend line of the currency pair.
• The colored line is a more complex tool; a change in its color should alert the trader to a weakening or strengthening of the existing trend.
It is assumed that blue indicates an uptrend, red indicates a downtrend, and gray serves as a reversal signal. You can get a full understanding of the color correspondence by observing the behavior of the trend indicator.
The tool has a host of additional parameters that can improve its efficiency. You'll find their explanations and configuration recommendations in the archive along with the script itself.
Recommendations for use:
When opening a trade, focus on both lines. For example, the green line indicates a continuation of the downtrend, while the colored line (colored red) indicates a short position.
It's best to enter the market when the existing trend reverses, as this approach yields the greatest profit.
Download the Trend Indicator.

