Currency Heat Map indicator for MetaTrader 4
The currency heat map is a color-coded display of the trend direction for various currency pairs over a specific time period.
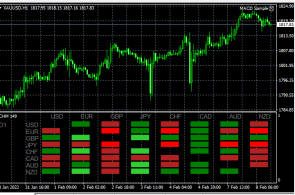
You can find a similar tool on many information portals, but it will still be more convenient to use a special indicator.
Thanks to which all the necessary information about the trend will be displayed directly in your trading platform.
The devisen-heatmap indicator presented in this article is intended for installation in the Metatrader 4.
After you have downloaded the archived file with the script itself at the end of this article and unzipped it, proceed to the standard installation by copying it to the directory with indicators called "Market".
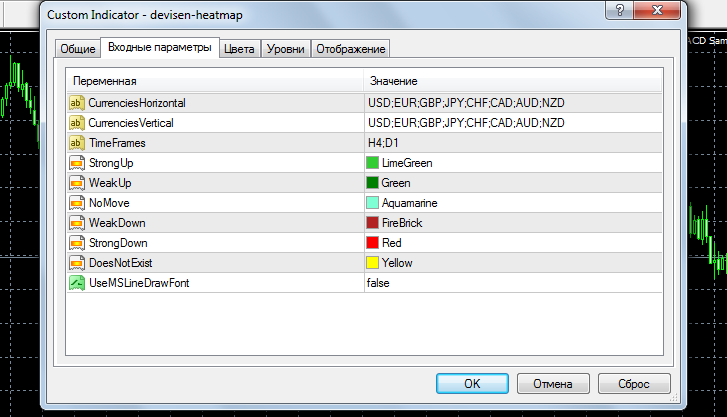
In general, the settings are quite simple - in the first two lines we indicate the currencies that will form the currency pair, then we indicate the time frame, by default this is H4 and D1.
The following lines select color settings:
Strong Up – the dominant uptrend, light green by default.
Weak Up – the dominant uptrend during the week, dark green.
No Move – there is a horizontal trend or flat on the market, dark blue by default.
Next come similar settings for a downward trend.
After we have installed the indicator on the chart, the following picture is observed:
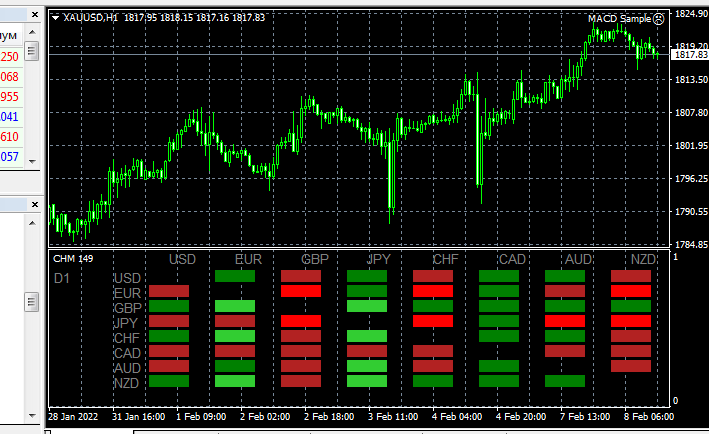
Overall, the tool works quite correctly, the only thing missing is displaying the price difference relative to the previous time frame.
Even so, the overall picture for the selected currency pairs becomes more or less clear. The indicator allows us to understand how much a currency is rising or falling in value against several other currencies, that is, to identify the actual trend for a given currency. For example, the image above clearly shows how the Canadian dollar (CAD) is strengthening.

