An accurate Forex indicator – tested on different timeframes
The search query "accurate forex indicator" is one of the most popular in the financial markets field.
 It's hard to find a trader who hasn't at least once typed it into a Yandex or Google search bar at various stages of their FX career, trying to find a suitable script.
The essence of the problem is that the scripts available today are not always of high quality and cannot objectively assess the market situation.
Many technical analysis indicators provide unreliable forecasts and then adjust their performance history to improve the results.
Is there a truly accurate indicator for market analysis, or is it a myth? We asked the experts at our information partner, the brokerage company NEFTEPROMBANKFX, this question.
|
NPBFX (NEFTEPROMBANKFX) is a brokerage company providing financial services since 1996. The broker's clients include retail and institutional investors from around the world. The broker provides direct access to Tier 1 interbank liquidity, with order execution performed using STP/NDD technology through its own liquidity aggregator. All NPBFX clients are insured for €20,000, which they can access from the Financial Commission, a self-regulatory organization with Category A status. |
Let's return to our request. According to the experts at our partner NPBFX, an indicator that meets our requirements should be as simple as possible and allow for trend-following trading.
This immediately brings to mind the classic saying that the trend is our friend. One such indicator, considered accurate, is the Moving Average. This is what we will discuss in this article.
We will not only introduce you to this technical indicator, but also test how accurately it allows you to forecast the market on different time periods (timeframes).
A Brief Introduction to the Accurate Moving Average
Why so brief? The point is that moving averages could be the subject of a full-fledged tutorial.
We didn't set such a goal for ourselves; anyone interested in the indicator can easily find detailed information about it online. Moreover, we'll only be considering the Exponential Moving Average (EMA).
The EMA is interesting because it has a significant advantage over other moving averages, such as the simple moving average (SMA). When calculating, it places greater weight on recent price values and less weight on more distant ones.
This allows traders to react most effectively to any price changes. When using an EMA, it's important to understand that the weight given to the latest price value is directly dependent on the moving average period. That is, the shorter the period, the greater the weight given to the latest price.
This feature of EMAs is successfully used by traders to analyze the market and find the best entry points. Typically, at least two EMAs with different periods are used. For those unfamiliar, a period is the number of candles used to calculate the EMA.
For example, if you're working on a daily chart of an instrument and select an EMA period of 10, the average will be calculated based on the price values of ten daily candlesticks. In practice, traders use the following exponential moving average periods:
- 10 and 25 are periods of fast and sensitive EMA.
- 100 and 200 are periods of slow, smoothly moving EMA.
- 50 is something in between fast and slow EMAs.
Using EMA with short and long periods
By installing a long-period EMA on your chart, you can accurately determine the current market trend. If the EMA slopes upward, the trend is bullish; if it slopes downward, the trend is bearish.
Identifying a trend allows a trader to work in its direction, which minimizes risks and significantly increases the likelihood of making a profit.

The second EMA with a shorter period is used to determine market entry points and can also indicate market reversals. The shorter EMA is more sensitive to price changes, allowing you to enter with the trend during corrective pullbacks or even at the very beginning of a new trend.
Next, we suggest moving on to price charts and examining how the EMA performs across different timeframes. We'll try to determine on which timeframes the indicator provides traders with the most accurate trading information.
Testing EMA on the weekly timeframe W1
For this test, we'll use the most popular currency pair, EURUSD, and EMA period settings of 10 and 100. Please note the price chart:
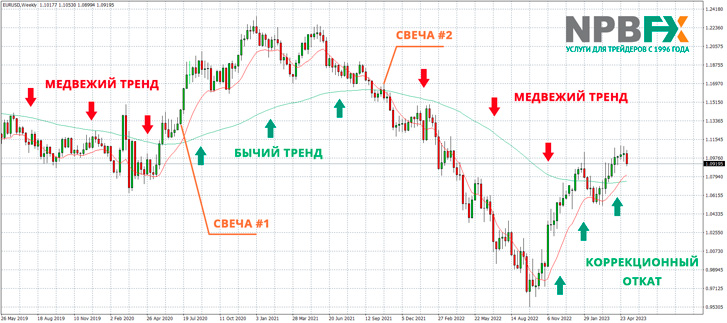
A 100-period moving average (MA) is an excellent indicator of the current market trend. A 10-period MA indicates points where trend changes occur. If the fast MA (red) crosses the slow MA (green) from below, this signals the emergence of a bullish trend. If the fast MA crosses the slow MA from above, the trend has shifted to bearish. As can be seen from the chart, after the MAs crossed, the trends actually changed, and prices moved significantly in the new direction. Candlesticks #1 and #2 are the levels at which a trader could open buy or sell trades.
Profit was guaranteed on all trades! On average, trends lasted from six months to a year, and the profit you could earn on each trade was between 1,000 and 2,000 pips.
Testing EMA on the daily timeframe D1
Let's try reducing the timeframe to daily with the same moving average settings. Admittedly, not all traders trade on weekly charts.
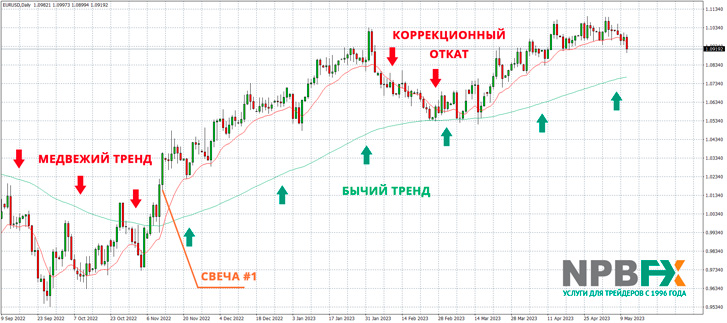
It would seem that the time period has shortened, and there should be more entry signals, but on the chart we see only one (Candlestick #1). The bearish trend has turned bullish, after which the euro's price has risen for six months.
From this, we can conclude that switching from W1 to D1 did not increase the number of trading signals from the indicator. Moreover, trends themselves can also last up to six months or more. Of course, it was possible to profit from the corrective pullback we indicated on the chart. However, doing so during an uptrend is quite risky.
Testing EMA on the H1 timeframe
Let's try switching to the hourly timeframe and observe how the indicator behaves here. The moving average period settings remain the same.
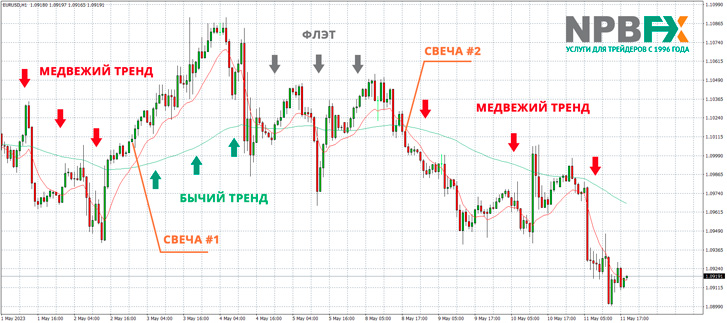
As you can see, there are significantly more intersections of the two moving averages, four in total on the chart. This is a signal to enter a trade. Meanwhile, a phenomenon known as a flat has appeared on the chart, when quotes move in a sideways price channel. Trading in a flat requires a different strategy, as well as the addition of new indicators. If we analyze our hourly chart, we see only two valid signals. The remaining two intersections of the moving averages can be classified as false signals.
It's become more difficult to determine what signal has emerged in the market, much less calculate which direction prices will exit a sideways market. In this case, it's necessary to analyze charts on higher timeframes.
It's worth noting that the periods during which trends persist have also shortened, as have the potential profit margins. This means you'll be able to open more trades over the course of, say, a month, but trading risks have increased proportionally.
Testing EMA on the five-minute timeframe M5
Finally, let's do one more test on the five-minute timeframe. Many traders, especially beginners, use M15 and M5 timeframes. We'll see how the indicator performs and whether it can be used for trading on minute timeframes.
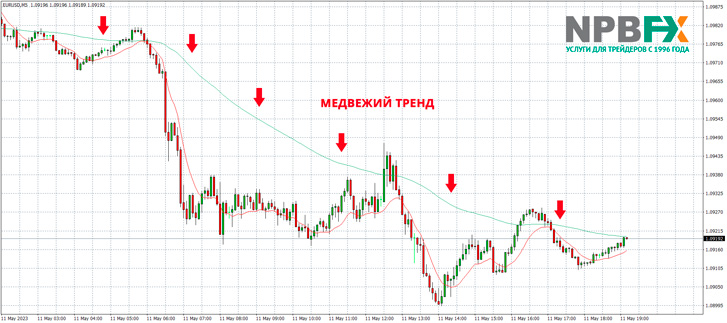
An interesting situation is observed on the chart. As you can see, the EURUSD pair was in a downtrend almost all night and all day. However, the indicator did not provide a single signal to open a trading position. During the day, the fast 10-period moving average approached the slow MA several times, but the intersection never occurred.
Essentially, these were short-term technical corrections in a bearish trend. This suggests that, despite using a 5-minute chart, you may not receive a signal throughout the day. Of course, you can try to trade corrective pullbacks, but again, this comes with increased trading risks.
Conclusions
What general conclusions can be drawn from our objective testing of the Moving Average (EMA) technical indicator? It can rightfully be considered a precise indicator. By using two moving averages with different periods, the direction of the current market trend can be determined with maximum precision. High accuracy is also observed when generating trading signals using the indicator.
This is especially true for higher timeframes. On weekly and daily charts, after trade entry signals appeared, the instrument's price moved in the desired direction 100% of the time. As the timeframe decreases, the accuracy of the signals begins to decrease, and false signals appear. Additional indicators are required to filter out false signals.

Overall, the Moving Average indicator is easy to use for traders using long- and medium-term strategies. However, those trading short-term trades on minute timeframes will find it quite challenging.
And don't forget that successful trading depends not only on your strategy and indicator, but also on your broker. Therefore, we recommend trading only with trusted and reliable financial service providers, such as our partner, the international broker NPBFX (NEFTEPROMBANKFX).
The company doesn't limit clients in their choice of trading strategies, offers flexible terms on trading accounts, and low rates: 0% commission on trading volume, spreads from 0.0, and no hidden charges.
A specialized analytical portal is available directly in your personal account, offering numerous technical indicators, precise trading signals, 60 trading systems, and training from scratch. Access to all portal materials is completely free. You can register and start trading on a demo, cent, or standard trading account on the official NPBFX.

