The relationship between price and volume in stock trading. Equivolume chart
Many traders, when conducting their stock market analysis, use only one indicator: volume. Market volume is the market's driver, the face of the market, and characterizes many of the processes occurring on the chart.

Volume reflects the liquidity of an instrument, reveals the opportunity to buy or sell at a favorable price, and acts as a magnet that attracts numerous players.
Anyone who has ever observed stock movements and volume has likely seen a scene where a large influx of players, building a large position, simply devastates the price and pushes it far beyond its established range.
This situation often occurs when a key group of players attempts to break through a certain psychological price level. The appearance of large volume can signal the end of a trend and a market reversal.
Market volume is the fuel that drives prices. Knowing how to correctly read market volume allows you to recognize the fading of a trend, confirm the strength of a market breakout, or determine whether it is a false one.
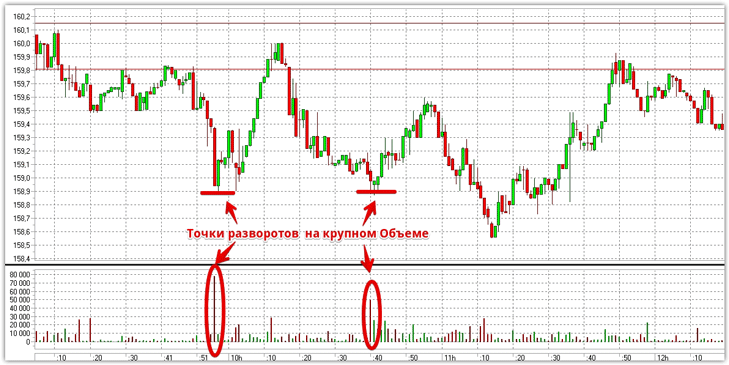
The chart above clearly shows how the price moved by inertia, with volume fading before a reversal. Therefore, an experienced trader could easily read from the chart that there was no major player behind this move and that a halt and subsequent reversal could soon occur.
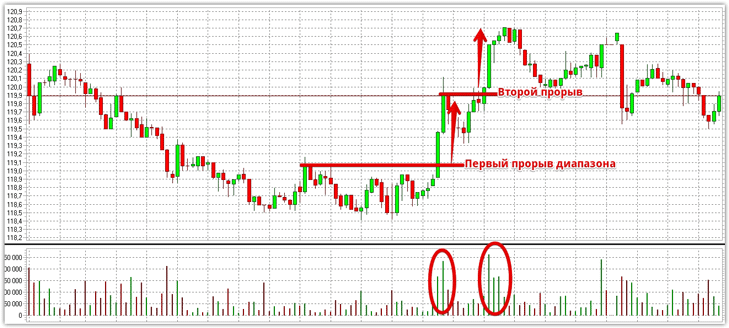
Also, the appearance of significant price volume near an important level or at the moment of its breakout can serve as confirmation for a market entry. For example, let's look at Sberbank shares. The volumes show that the breakout of local support and resistance levels was driven by a crowd and a mass of orders, not market inertia.
Equivolume Charts. Creating in MT4.
So-called equivolume charts are particularly popular among traders. They were first introduced back in 1971. Their essence lies in displaying market volume not by displaying individual data, but by creating specialized charts based on it. Implementing this chart is visually simple: the higher the volume, the wider the bars drawn by the terminal.
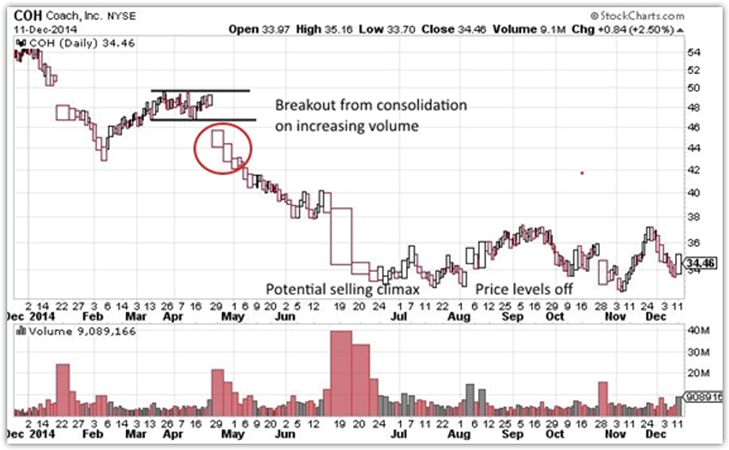
This eliminates the need for traders to search for additional information, and breakouts and other market situations are easily explained by the chart itself. As an example, we suggest viewing what a breakout with confirmation looks like on an equivolume chart:
Unfortunately, unlike the stock market, the Forex market doesn't offer the ability to measure or see actual trading volume. However, tick volume can be measured. Naturally, for obvious reasons, MT4 doesn't offer this type of chart, but that doesn't mean it's impossible to implement it in your MT4 trading terminal.
To implement an equivolume chart in the MT4 trading terminal, we need to collect the most basic information—tick history. For some reason, developers don't save tick history, so to collect it, we'll need a special TickSave expert advisor, which will automatically save all tick changes after applying it to the chart.
It's important to understand that ticks will be saved as long as your trading terminal and expert advisor are running. This history can serve as a basis for testing and can also help you build equivolume charts.
After collecting the data, you need to transform your ticks into a special chart. The principle of building an equivolume chart in MT4 is very similar to building a Renko chart. For this, use the EqualVolumeBars expert advisor. To begin, install the expert advisor in your trading terminal by dropping the file into the "expert" folder of the trading terminal.
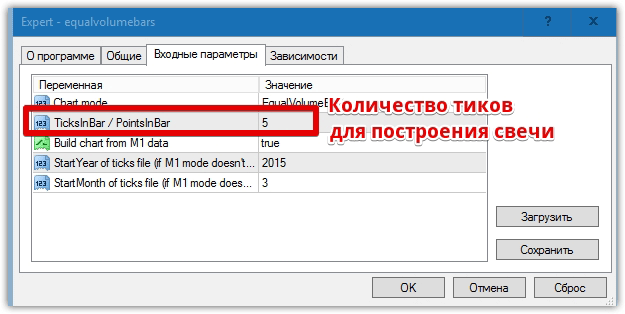
You can access this folder through the File menu. After installing the expert advisor, apply EqualVolumeBars to the minute chart of any currency pair. In the settings that appear, in the "Ticks in Bars" line, specify the number of ticks that will form one candlestick.
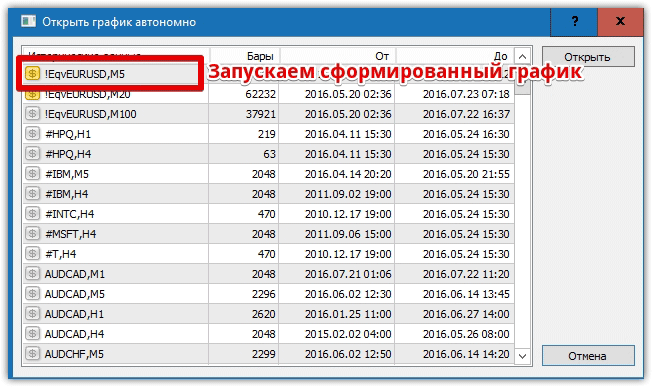
After the expert advisor starts working, you'll need to open an offline chart with a name corresponding to the number of ticks per candle. To do this, open the File menu and select "Open Offline," then launch the chart corresponding to the number of ticks per candle.
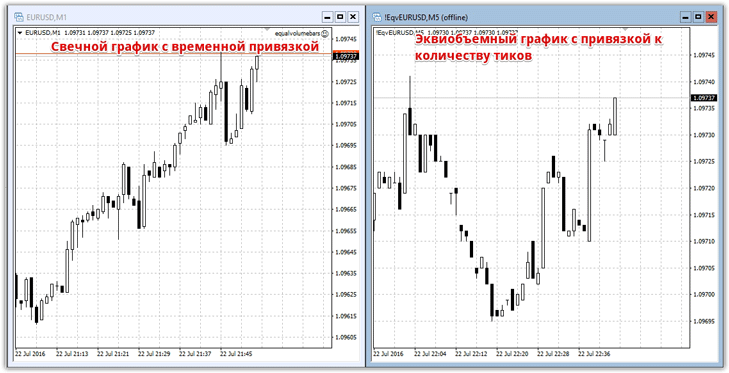
For the equivolume chart to work fully and appear online, you must constantly run the EqualVolumeBars expert advisor in a separate window, which will relay ticks to our chart. See below for an example of a comparison between a standard and equivolume chart:
In conclusion, I'd like to point out that volumes have a tremendous impact on price movements, and in the first part of the article, we tried to illustrate this with examples. Speaking of an equivolume chart for the Forex market, it's worth noting that it allows you to look at the price from a completely different perspective and is especially useful for traders using pipsing and scalping.
Download the necessary scripts.

