MaxProfit is a transaction accounting program.
No matter which investment and stock trading textbook you open, each one contains a set of rules,  adherence to which is essential for successful trading. One of these unspoken rules is keeping a trader's journal, in which you record when and what trades you made.
This is primarily necessary so that you can analyze your trading strategy, your capital management method, and understand and identify the mistakes you made during the trading period.
Almost everyone ignores this rule, but even in school, students who made a lot of mistakes in their assignments work on their mistakes. So why don't you analyze your mistakes? Is it really true that a student who's doing such a simple task, which will help them avoid making the same mistakes, is smarter than you? And yet, unlike you, they're not losing money!
Simply put, you have the opportunity to put away your calculator and Excel, without wasting your weekends on long and grueling calculations of your indicators, because by loading only the transaction history into the program, it will immediately perform the necessary analysis in a couple of minutes and display all your indicators in the form of graphs and tables.
Another notable advantage of this program is that you can manually add various transactions by attaching photos and screenshots to them, which will immediately remind you why you made a particular transaction. You can't just sketch all this out in a notebook, and what notebook would you even consider when we live in an era of advanced technology that would be a shame not to take advantage of.
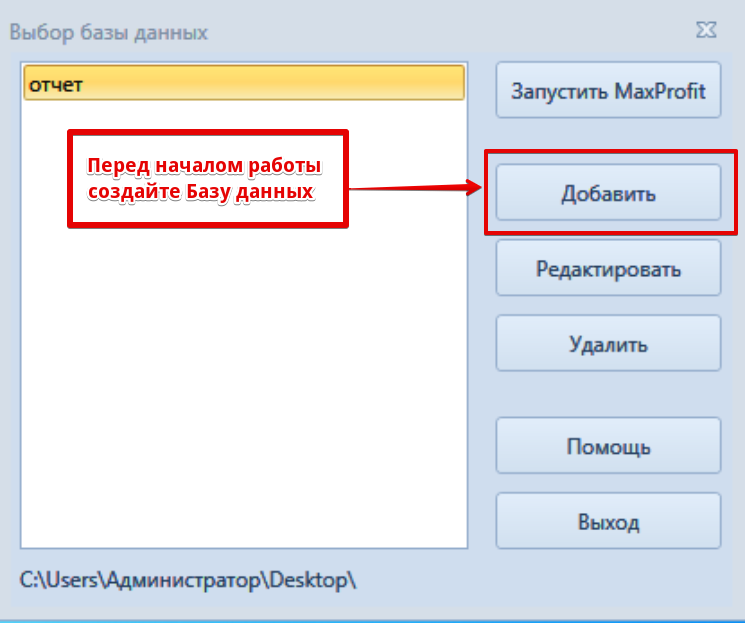
After launching MaxProfit, you need to create a database. The process is very simple: click the "Add" icon and specify the path to the database. This ensures that all the data you enter during your work is not lost and the program can function smoothly. In other words, the database will store the history of trades and analyses provided by the program.
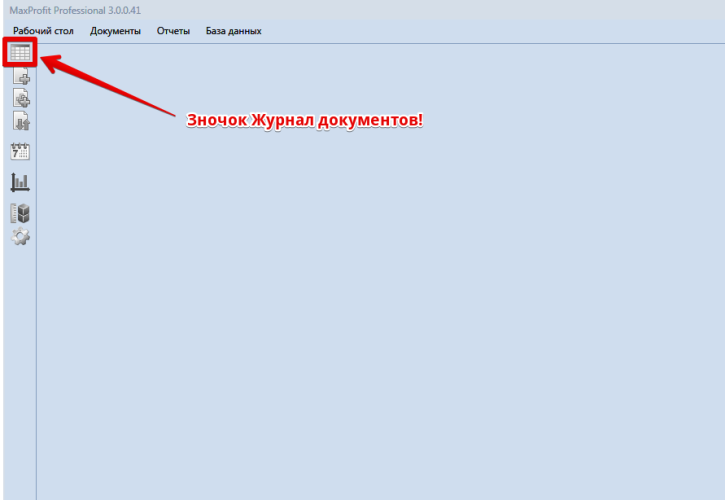
Once you've created the database, you can launch the program by clicking the "Run MaxProfit" menu item. To begin generating reports, the program needs to analyze your transaction history. To do this, click the document log icon:
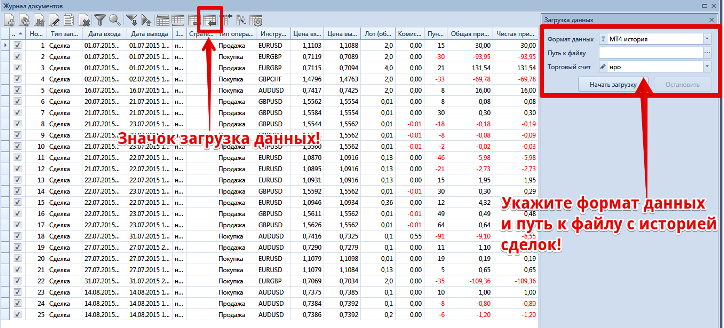
A new window will open where you can edit or delete positions and change historical data. To download your trade history, click the "Download data" icon. You can configure your history to be downloaded directly from the Meta Trader 4 and 5 terminals, as well as Quik and Ninja Trader. You can also submit your trade history as an Excel file for analysis. In the window that appears, specify the data format and the folder where the file is located.
But where do you get your trade history from if the MT4 and MT5 trading terminals provide data as a web file, not the one the program requires? To collect all your historical trade data and format it into a text file, the developers created the HistoryMaxProfit script, which must be installed on the trading platform.
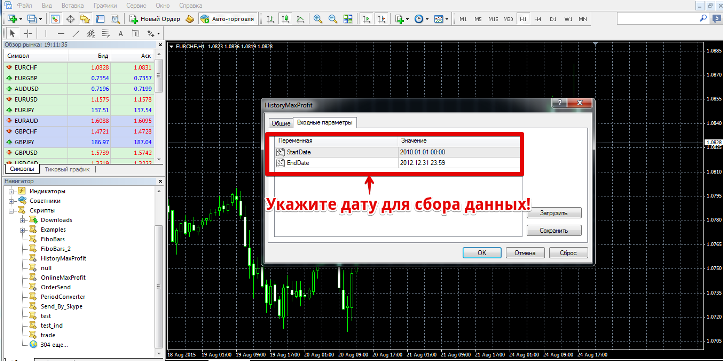
Installing a script is no different from installing an Expert Advisor or indicator. To do this, open the MT4 trading platform and go to the File tab. In the list of folders that appears, find the Scripts folder and place the file there. After restarting the terminal, open the scripts list in the navigator panel and drag HistoryMaxProfit. A window will appear in which you must specify the date from which and to which you want to collect the transaction history.
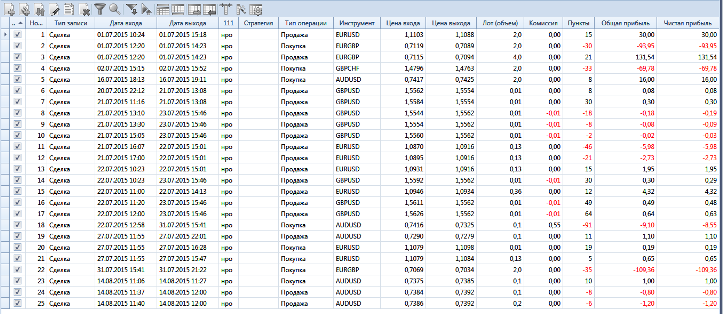
After running the script, it will automatically save your trade history in the format required by the program. You can find the file in the Files folder, which you can access through your terminal's data directory. After you've converted your trade history, you need to upload it as described and shown in the image above. If you've done everything correctly, a table with a list of your trades will appear in the program window:
To view the reports generated by MaxProfit, go to the main page and select the "Reports" tab. In this example, I'll use the trade history of an Expert Advisor that our team tested on the server. It wasn't a successful experience, but it's useful for clarity. Several types of reports are available.
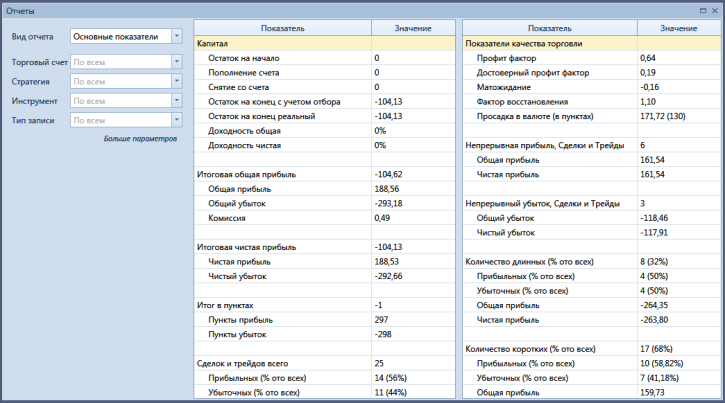
The first item on the list is "Key Indicators," which is displayed as a table with data such as profit factor, net profit, number of trades, number of profitable and losing trades, total profit, total loss, commission, and so on. You can see the report itself in the image below:
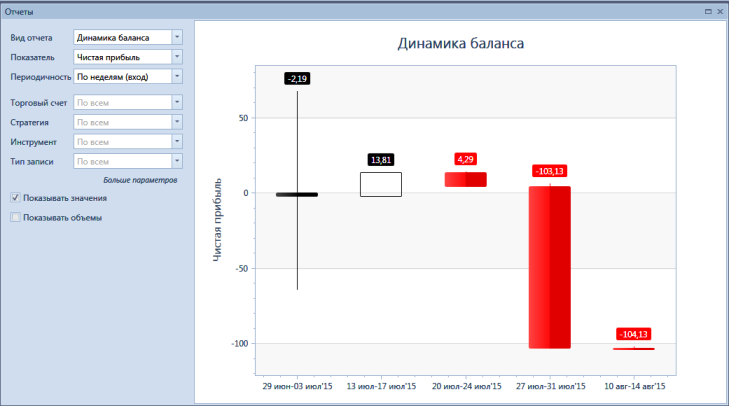
In addition to the main report, you have access to a number of other metrics. By switching to the Report View menu and selecting the overall balance trend metric, I was able to see how my balance changed daily. Moreover, if you look at my example, you can clearly see which day I lost the most funds:
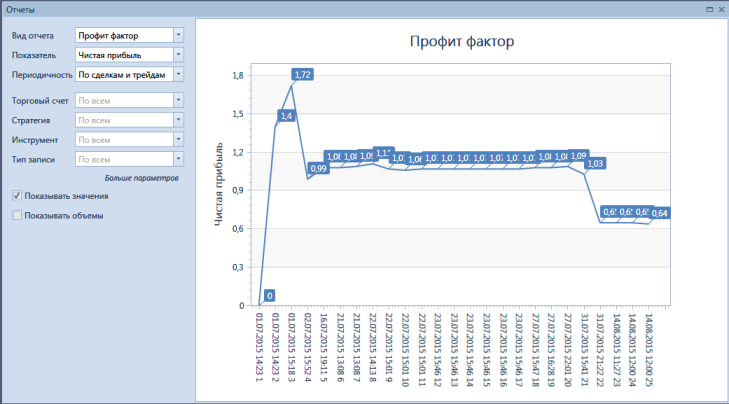
You can also see the profit factor of your trading strategy—not just a simple final figure, but rather the dynamics of its changes over the course of a day. The image below shows how the advisor initially showed good results, but over time, its trading strategy became less and less profitable.
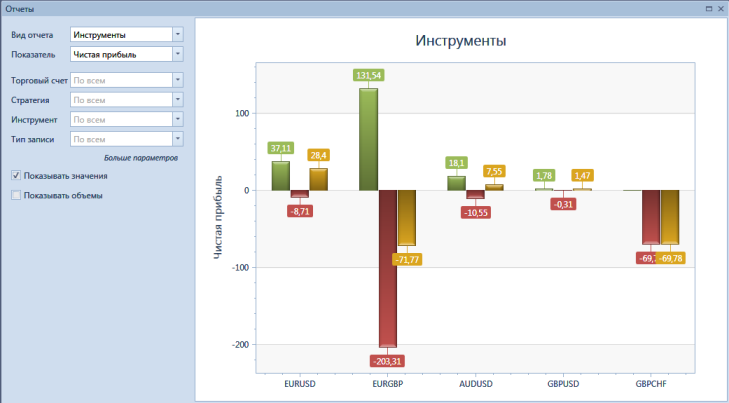
In addition to these indicators, you have access to: Reliable Profit Factor, Expected Payout, Profit/Loss, Trading Dynamics, Percentage Income, Instruments, Strategies, Short/Long Ratio, and Weight Ranges. The "Instruments" indicator proved particularly useful when analyzing the EA's performance. It shows overall profit and loss statistics for the currency pairs traded by the EA. Ultimately, it turned out that the EA is generally good, but its strategy doesn't work on the EUR/GBP and GBP/CHF currency pairs, something I wouldn't have noticed with my own eyes in this pile of trades:
The program also includes a calculator for calculating the trading lot size, which will help you always adhere to sound capital management. Overall, this is a truly useful, functional program that will help you conduct a detailed analysis of your trading tactics and point out any shortcomings.
A notable advantage of this program is that the annual license costs only 1,100 rubles, and you can try out the program's functionality completely free for 15 days using the demo version. You can download the program from the official website www.mxprofit.ru
Remember, a detailed analysis of completed transactions is the path to understanding your mistakes and, as a result, to solving them.

