Forex channel indicators, the most effective options.
In most cases, a Forex trend, when moving, forms a clearly defined channel; the effective use of such channels can significantly improve the financial results of trading.
By constructing a price channel, you get an almost complete picture of the current situation - the direction of the existing trend, the width of price fluctuations, the magnitude of the correction, the level of minimum and maximum prices.
At the moment, almost all constructions are carried out using channel indicators, we will talk about their options in this article, and links to downloading the scripts themselves will also be provided.
Technical analysis tools.
Recently, Forex trading using fundamental analysis has significantly lost its effectiveness, so technical analysis tools are gaining more and more popularity. Technical analysis is the key method for studying the market situation, and the data obtained is used to make forecasts.
Technical analysis tools are everything that helps to carry it out; this group includes indicators and oscillators, graphical figures, as well as regular visual analysis.
It is not at all necessary to use only one of the listed options; an integrated approach has always given the best result.
Forex levels.
It is the levels that are one of the main guidelines when opening new transactions on Forex; they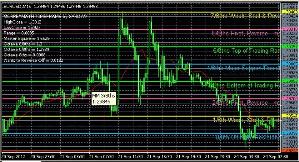
Forex levels are used in strategies such as trading on a breakout or reversal, trading in a price channel and some other options, the main thing is to choose the right level that is right for you.
Basically in trading, levels such as support and resistance, basic points, Murray levels and other similar options are used.
Forex volume.
The concept of volume is quite often found in technical analysis of financial markets; it is this indicator that serves as the main confirmation of an emerging or current trend.
Forex volume characterizes the number of transactions on a particular currency pair, as well as the total amount of transactions concluded over a certain period of time.
At the same time, it is advisable to consider changes in volumes only over short time periods; in other cases, this indicator does not always correctly reflect the current situation and may be the cause of erroneous actions.
Lines of support and resistance.
The movement of a trend in the Forex currency market is subject to its own law; the price either rises to a certain point or falls down.
In this case, so-called minimums and maximums are formed, which characterize the peaks and troughs on the price chart. These points correspond to a certain time period; on each time frame they are different and purely individual.
It is the minimums and maximums that are used as the basis for constructing support and resistance lines; at least two points on the chart of the currency pair are required for construction.
How to determine a trend visually or using indicators
Trading with a trend is the basis of most strategies that are currently used in Forex, so one of the pressing questions is how to determine the trend, or rather its direction, over a selected time period.
To understand this issue more accurately, you should clearly understand what a trend is and what its direction depends on, as well as understand some of the features of determining its movement.
First of all, it should be noted that the direction of the trend directly depends on the time period on which you conduct technical analysis.
That is, if there was a price increase during the day, this does not mean that it grew continuously without significant fluctuations.
It is this aspect that plays a fundamental role in determining price movement on the working timeframe.
Technical analysis methods
There are several basic methods of technical analysis of the Forex market, which allow you to assess the current situation. It is advisable for a novice trader to have an idea of all the existing options, and only then choose the most suitable one for himself.
You should start studying with simpler and more understandable points, and only then move on to more complex work schemes.
It is not always the most difficult option for studying the market that will bring you the most accurate result and, as a result, the long-awaited profit.
Conventionally, all existing methods can be divided into graphic, cyclic, channel and levels.
There are also other options for studying the market. but today we will focus on the above listed
Principles of Technical Analysis
Most novice Forex traders underestimate the role of technical analysis and begin their trading solely on intuition; only after the first failures do they move on to a deeper study of the theoretical foundations of analysis.
When starting to study the basics of technical analysis, it is important to understand the basic principles on which it is based; there are not so many of them, so getting to know them will not take much of your time.
The principles of technical analysis reveal its essence and make it possible to understand what you should pay attention to first.
Technical Analysis Plan
Conducting technical analysis requires a specially designed action plan that will help maintain consistency and increase the efficiency of the process.
A properly drawn up plan is the basis for preparing for trading. Methodological literature mainly describes the methods and techniques of various types of market analysis, but how to apply the acquired knowledge in practice remains unattended.
The technical analysis plan for Forex depends on the specific method of studying the market that you have chosen for your trading strategy, but there are still common components in any of the plans.
Forex minimum and maximum points
The exchange rate always moves along a curve; at each time period, the main minimum and maximum points can be identified; they characterize the minimum and, accordingly, the maximum price level on a given time frame.
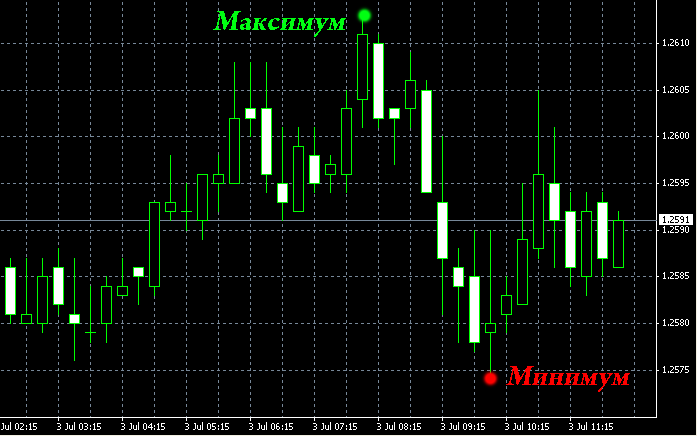
The meaning of these indicators is quite important, since it is these points that serve as the basis for building price channels and are used in many Forex strategies.
It is also the basis for conducting in-depth technical analysis.
For example, the minimum price for the EUR/USD currency pair during the day was 1.2574, that is, the price did not fall below this value during the day.
Minimum and maximum points serve as the main guidelines when drawing up many Forex trading strategies, therefore the effectiveness of all trading directly depends on their correct determination.
Overbought and oversold, how to determine these market conditions
The main indicators that affect the market price are supply and demand; it is the change in their value that has the greatest impact on the cost of shares, currencies and goods.
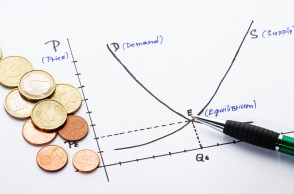
At the same time, the market does not always react to this event with an immediate reversal; there are points or zones in which there comes a time when the price of an asset does not suit buyers or sellers.
Such periods are called overbought and oversold markets.
Overbought market is the moment when price growth stops, since the number of people willing to buy an asset is practically reduced to a minimum, and the number of people willing to sell it begins to grow.
In relation to Forex, this indicator is characterized by the number of open sell orders; when it reaches the maximum level, the price does not want to rise anymore and traders begin to make short trades.
Which leads to an increase in the supply of currency and, accordingly, causes a downward trend in Forex . In order to control the number of open orders, a special informer “ Open positions of traders ”
Volatility of the currency or stock market
This concept plays a huge role when trading on Forex or other financial exchanges.
It is directly related to practical trading and serves as the main guideline for setting stop orders, and can also be useful in some other situations.
Market volatility is the range of price movements over a certain time period, that is, how much the price has changed over a given period of time.
In practice, two variants of this concept are considered - relative and complete, depending on for what purposes the obtained data is planned to be used.
By determining the value of daily volatility, you immediately get an idea of how dynamic the market is, and by conducting a comparative analysis of several pairs, you can identify the most attractive trading instrument.
Page 4 of 4
- To the begining
- Back
- 1
- 2
- 3
- 4
- Forward
- In the end

