Larry Williams' Strategy
Like any well-known trader, Larry Williams wrote a very interesting book about his approach to  financial markets, revealed some secrets of his trading strategy, and showed the world that a simple trading strategy, coupled with competent capital management, can bring simply unimaginable profits.
Many people are wary of trading textbooks, as it is increasingly the writers who write the books, not the actual trading practitioners.
That's why we increasingly see multi-page publications from various authors, but behind the ton of unnecessary information, we miss the most important thing: a truly working tool that will allow us to earn money on the stock exchange.
Larry Williams doesn't have the ability to talk the way other famous traders do; he is a rather taciturn person.
Therefore, he easily compressed all his knowledge and developments into just one book, and after years, not a single new edition has been published, which speaks to his commitment to his views and system to this day.
Key points of Larry Williams' strategy.
The signals generated by Larry Williams' strategy are based on bar analysis, so make sure your chart displays bars rather than Japanese candlesticks. This can be easily done by changing the chart type in the top panel of MT4 or MT5. The first bar combination is called "Swing Limits.".
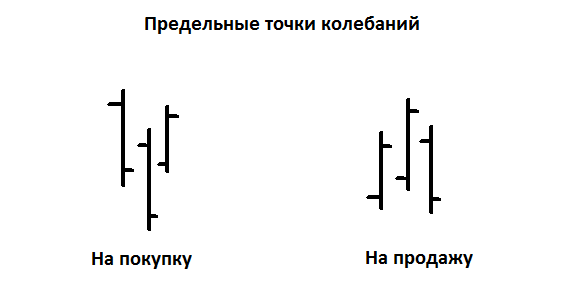
This formation consists of three bars that form a sort of local high or low. To identify this formation for buy signals, the low of the central bar must be lower than the left and right bars.
The basis is a bar whose low is higher than the previous one, and if the next bar appears with a low also lower than the average, we enter a buy position at its close. A sell signal is generated in exactly the same way, but the middle bar must form a high, and the two adjacent bars must form highs lower than the average. For a better understanding, I suggest looking at the image below.
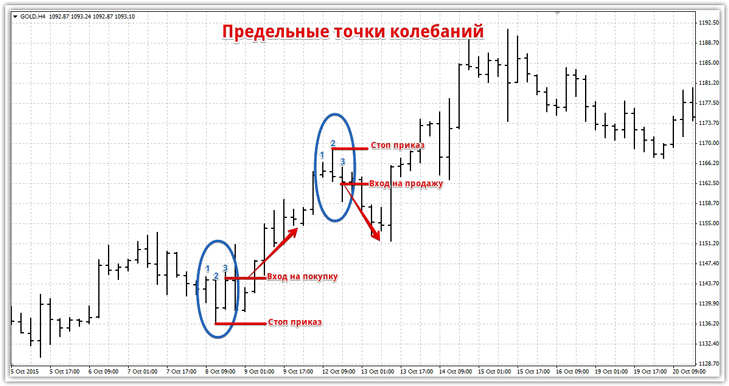
Larry Williams argues that signals can occur against the underlying trend, so it's important to clearly understand the market trend to eliminate false signals. To do this, the author suggests using moving averages or other trend-following tools.
For a buy signal, the author recommends placing a stop order a few points away from the middle bar's low, and for a sell signal, a few points away from the middle bar's high. An example of a position entry signal is shown in the image below:
The second bar combination Larry Williams identified for his trading is called the "Inside and Outside Day." An inside day consists of two bars, with the first bar used as a reference point, and the second bar must be inside it, meaning its low and high must be lower than the previous bar.
How to determine in which direction to open a trade?
To do this, look at the second bar. If its closing price is higher than the opening price, enter a buy trade. If the closing price is lower than the opening price, enter a sell trade. I recommend reviewing the image below to understand the concept:
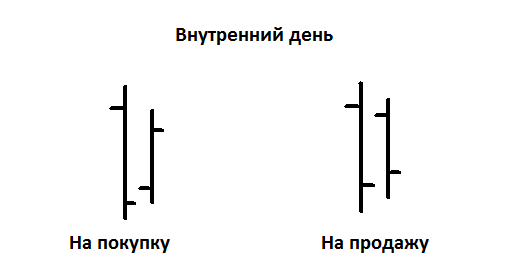
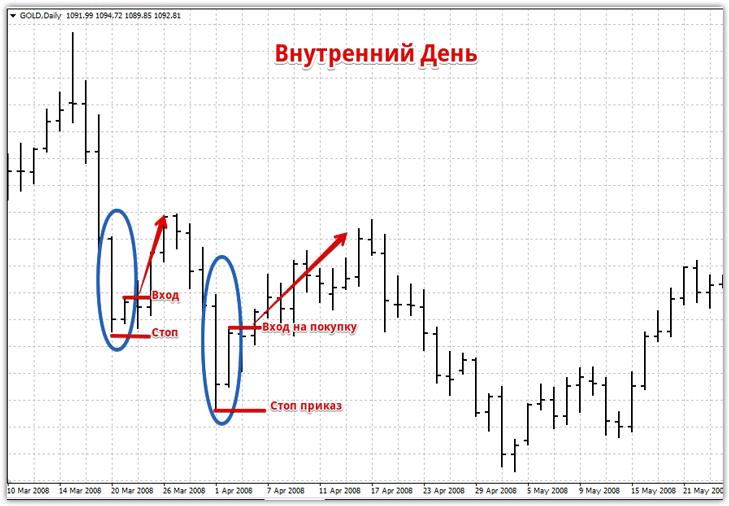
When working with this signal, when entering a buy position, we limit risks at the low of the first bar, and when entering a sell position, we set a stop loss at the high of the previous bar. An example of the signal's appearance and its execution on a real chart is shown in the image below:
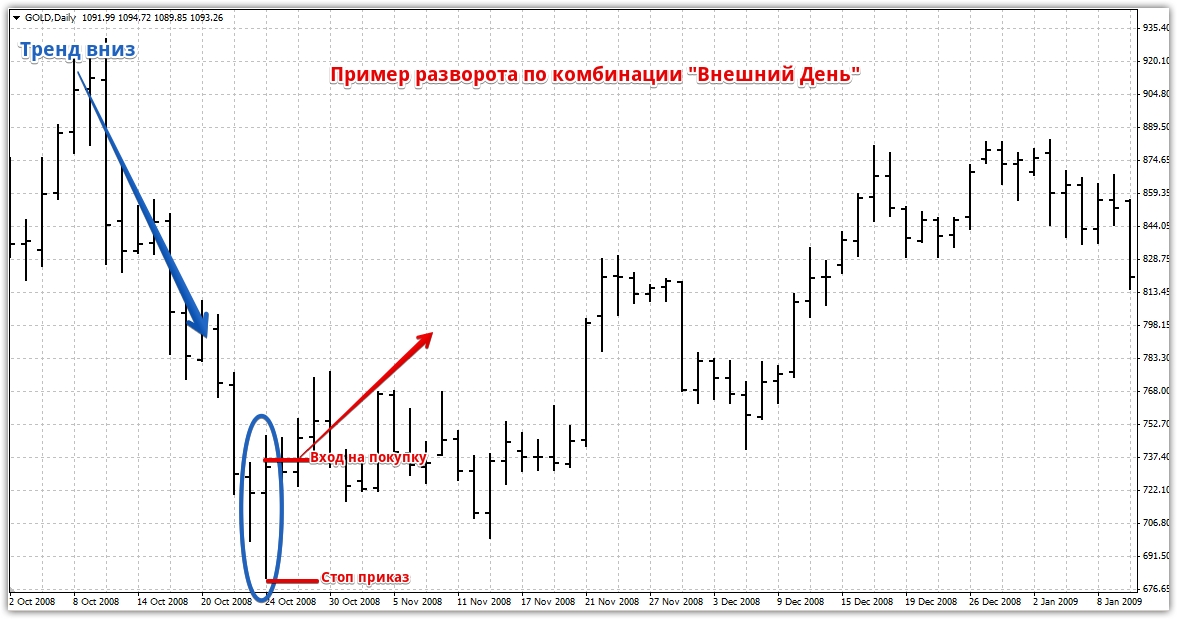
 An "Outside Day" is formed exactly the opposite of an "Inside Day." This combination also consists of two bars, with the second bar's low and high being higher than the first, and the first bar being inside the second. This combination doesn't indicate a precise entry point, but rather serves as a signal for a trend reversal. A visual representation of an "Outside Day" combination is shown in the image:
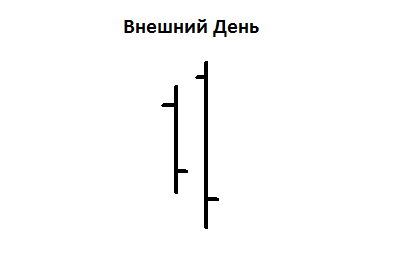 Using the "Outside Day" method boils down to trading against the trend. For example, if the market was rising and a combination appeared, we enter a sell trade. If the market was trending down, we enter a buy trade after the combination appeared. A stop loss should be placed at the low or high of the second bar, depending on which direction we enter.
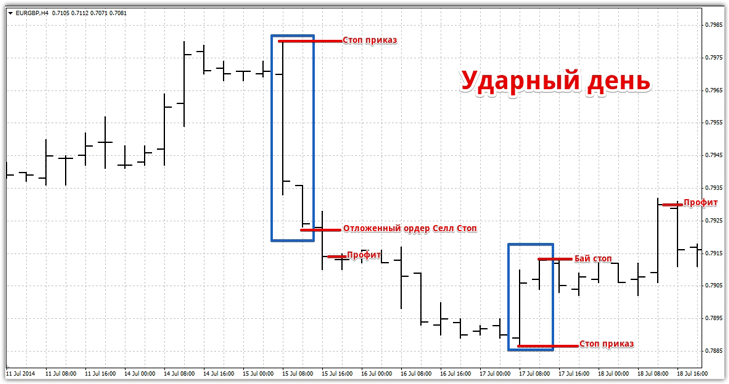
 The third bar combination that provides excellent buy or sell signals is called a "Strike Day." This combination consists of two bars, either rising or falling, but there must be a gap between the closing price of the previous bar and the opening price of the current bar. To better understand the concept of a "Strike Day," I suggest looking at the image below:
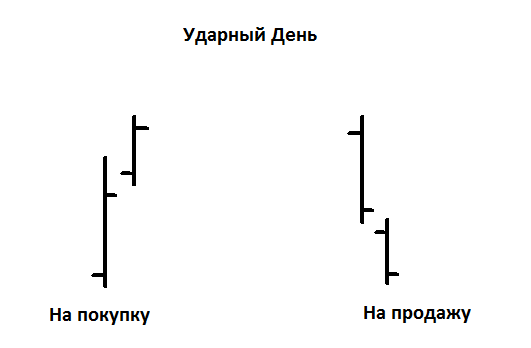 The combination is extremely simple to apply. If you receive a buy signal, you should place a buy stop pending order at the high of the second bar. If you receive a sell signal, you should place a sell stop pending order at the low of the second bar. Larry Williams clearly defined the targets for "Smash Day"—namely, exactly one bar. A stop is placed at the high or low of the first candle. An example of how to use this signal is shown in the image:
 As you may have noticed, Larry Williams' trading strategy consists of simple signalsbased on bar patterns. Thanks to his simple and clear rules for entering positions and setting stop orders, Larry has been able to earn millions of dollars.

