Canadian Employment Changes: Impact on USDCAD
Employment is an indicator of the well-being of a country's economy, its good  investment climate and the health of the economy as a whole.
Fundamental financial analysis should always take into account employment data, as it also affects the Canadian dollar exchange rate.
In fact, the logic for a trader and investor when this indicator is released should be very simple.
The more people are employed, the less unemployment benefits need to be paid, and as a result, the burden on the country's main budget is reduced.
It's also worth remembering that the more people employed, the greater the percentage of taxes the state will collect, which directly leads to a stronger economy, higher social standards, and the development of the state in various sectors.
The Canadian Employment Change is a monthly indicator of the number of people employed in Canada, which has a strong impact on the CAD exchange rate at the time of the news release and for some time afterward. Many note that volatility, making it very difficult to interpret.
In fact, everyone knows that the release of employment data quickly reacts to the movement of the Canadian dollar chart, but I have not found more useful information about how the price behaves at the time of the release of the indicator and after.
To study the impact of this indicator on price movement, I used one of the most popular instruments that includes the CAD—the USD/CAD currency pair. The pair has a low spread with almost every broker, making it the most common choice when trading the CAD.
I'm very interested in how long the average price moves after a news release, what effect the indicator has on the market over time, and the overall price behavior. For the study, I selected the last four months of news releases.
On June 5, 2015, positive Canadian employment data was released. While the previous reading was -19.7K, the actual figure was 58.9K. This suggests an increase in employment, which in turn should lead to a stronger Canadian economy. On the USD/CAD currency pair chart, this should result in a decline, as the dollar weakens amid the good news for the CAD. You can see the actual price action below:
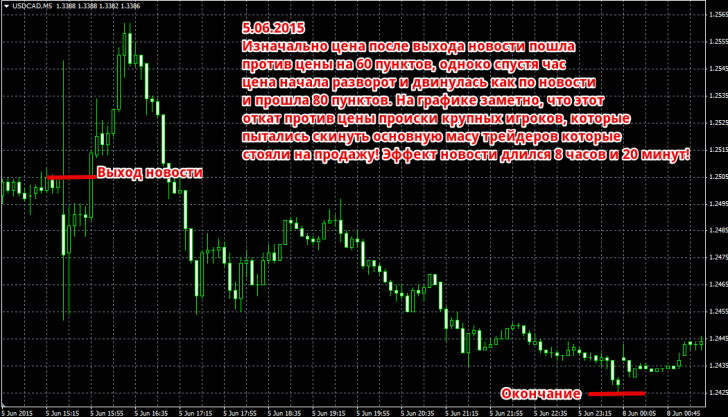
Judging by the chart, there was an interesting price spike at the news release, with the price moving in the opposite direction. Then, an hour later, the price began to move strongly in the direction of the positive employment data, moving 80 pips.
It's worth noting that the price spike you're seeing is caused by major players who deliberately pushed the price toward the stop orders of traders who were selling. If you had a small stop loss, you would have been knocked out of the market.
On July 10, 2015, some rather contradictory data was released. Experts predicted a decline in the employed population to -10,000, but the actual figure was -6.4,000. Many perceived this as good news, but in reality, employment fell from the previous value of 58.9,000 to -6.4,000, which should immediately be reflected in a rise in the USDCAD currency pair. You can see the actual price action in the image below:
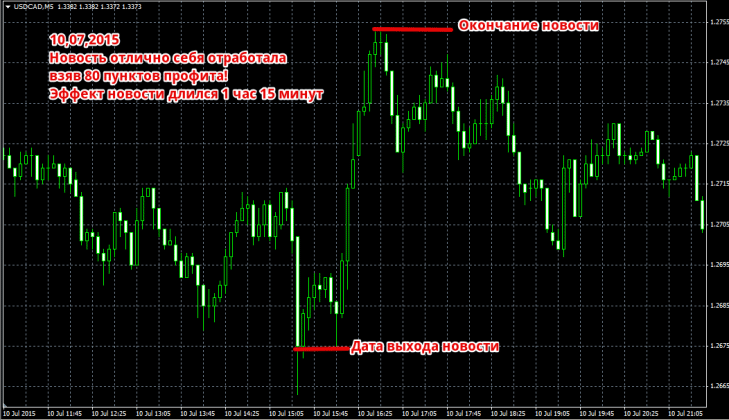
Judging by the chart, the price reacted immediately to the news release and closed 80 pips higher. It's worth noting that the news's impact lasted for 1 hour and 15 minutes, after which the price began to retreat in large waves and almost returned to its original positions.
On August 7, 2015, most analysts predicted an increase in employment, highlighting a 5.0K figure versus the previous -6.4K. In fact, the news came out with a 6.6K figure, indicating an increase in employment, and a consequent decline in the USD/CAD currency pair. The price reaction to this event is shown in the figure below:
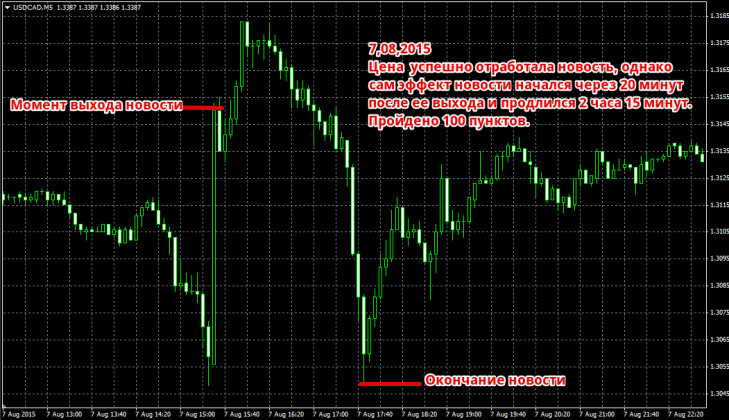
The chart shows that after the news release, the price moved in the opposite direction by about 25 pips, and then 20 minutes later, it recovered nicely, taking a 100-pip profit. The news impacted the market for 2 hours and 15 minutes.
On September 4, 2015, some fairly positive data was released, so most traders expected a sharp decline in the USD/CAD currency pair. However, the real picture can be seen in the image below:
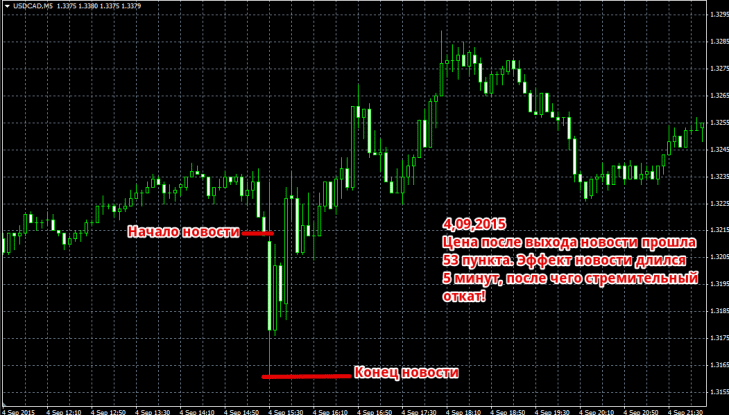
You can see on the chart that a gap formed between candlesticks after the employment data release, with the next open candlestick being 53 pips wide. Regarding the effect of the news, it was only active for five minutes at the time of publication, which simply wouldn't have given you the opportunity to profit from the initial spike. However, despite this, the price moved 53 pips, indicating the strength of the news.
Now let's draw a line. Based on the historical examples discussed, we can conclude that major players are speculating heavily on this news, initially pushing the price against the market. It's also worth noting that for four positions with a 60-point stop loss and an 80-point profit, you could have earned 80 + 80 + 80 - 60 = 180 points of profit.
You should also understand that the news is highly volatile, so you need to choose a broker with high order execution speed and direct access to the market in the form of an ECN account.

