
Ozymandias indicator
Almost every trader who approaches his trading more or less professionally knows one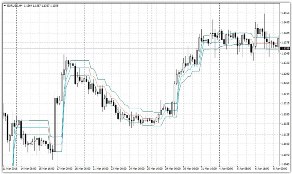 inviolable rule, which is that you need to let profits grow and losses should be quickly cut off.
Yes, in reality, if the reluctance to use stop orders and destroy unprofitable positions in the bud is more like stupidity, then with the implementation of the rule of allowing profits to grow, everything is much more difficult.
Of course, if we take this rule literally, then there is nothing easier than opening a position and waiting a long time and inexorably for the movement to work itself out.
However, we all know very well that the market never moves in a straight line and simply creates huge market noise.
The Ozymandias indicator is a working tool that allows you to look at the Forex market from a completely different perspective, since its main task is to filter out market noise. The indicator itself is designed to clearly identify the trend, and as a result, the direction of the transaction.
However, in addition to the banal function of filtering out market noise, Ozymandias can easily be used as a signal indicator or a separate trading strategy .
Installation of the script.
The Ozymandias indicator is a tool that is designed to work only in the Meta Trader4 trading platform. To use it, you need to install it. To do this, download the file with the indicator at the end of the article. Next, you need to open the MT4 data directory where all the indicators are located.
To open the data directory, simply enter the running platform in the file menu, where you select the appropriate menu item. In the directory that appears, find a folder called indicators and drop into it the file that you downloaded a minute earlier. After the installation is completed, it is necessary for the terminal to see the file.
In order for this to happen, we simply restart the trading platform or make an update in the “Navigator” section of the terminal. After the update, the indicator will appear in the “Custom” column, so just drag it onto the chart. As a result, you will get a graph like this:
Settings and operating principle
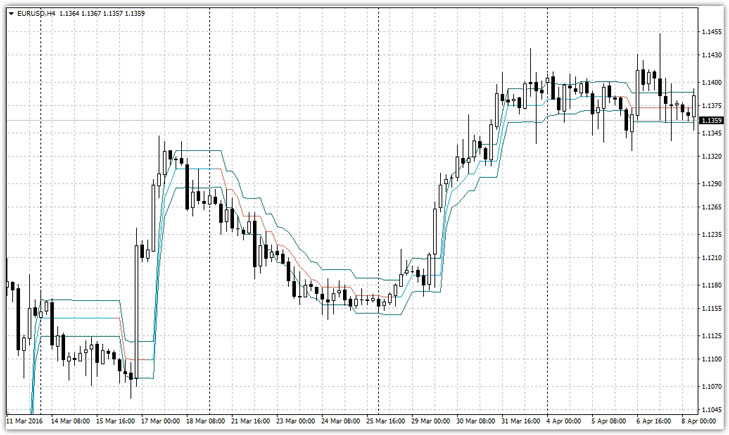
In the image above you can see that the Ozymandias indicator consists of three lines, and the central line can change color. Many people probably saw Bollinger Bands , but the principle of operation of these indicators is radically different.
So the central line displays the direction of the trend, namely, if it is green, then the market is in an upward trend, and if it is red, then it is downward. Due to the smoothing of the price, it is clear to the eye that the instrument is a little late, in fact, like any trend indicator. The two extreme blue lines represent overbought and oversold zones.
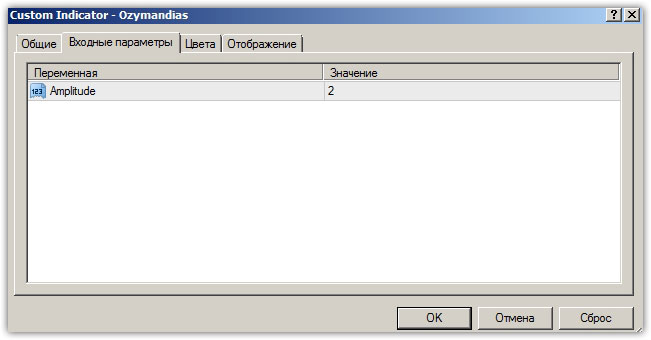
In the Ozymandias settings you can find only one parameter, namely Amplitude. This parameter indicates how many bars or candles are taken into account. In the settings you can specify a value of up to four.
If we talk about the principles of operation, Ozymandias finds Highs and Lows on the section of bars specified in the settings, upon breaking through which the trend is fixed. The extreme lines are constructed based on the ATR indicator and create a kind of range within which the main price movement occurs.
Signals Ozymandias
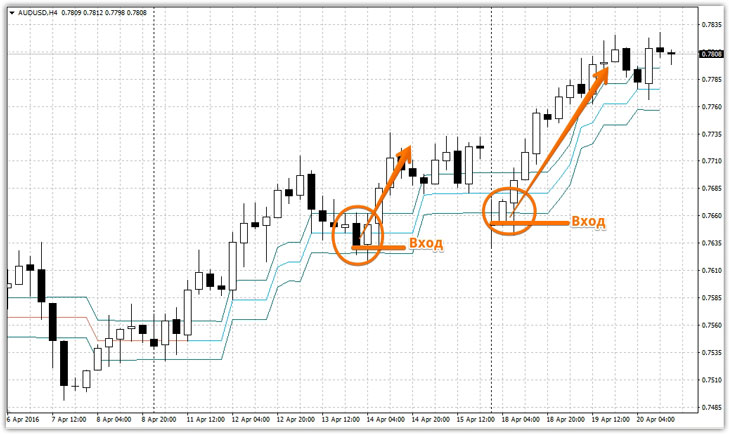
There are several options for using the indicator in trading. Naturally, the most common way is to blindly follow the trend. The essence of this method is that a position is opened when the color of the line changes. So if the color of the central line changes to red, we sell, if it changes to blue, we buy. Example below:
overbought and oversold  zones towards the main global trend.
So, to enter a buy position, Ozymandias must create the following conditions:
1) The center line is blue.
2) The price touched the lower border of the indicator (oversold zone).
Example:
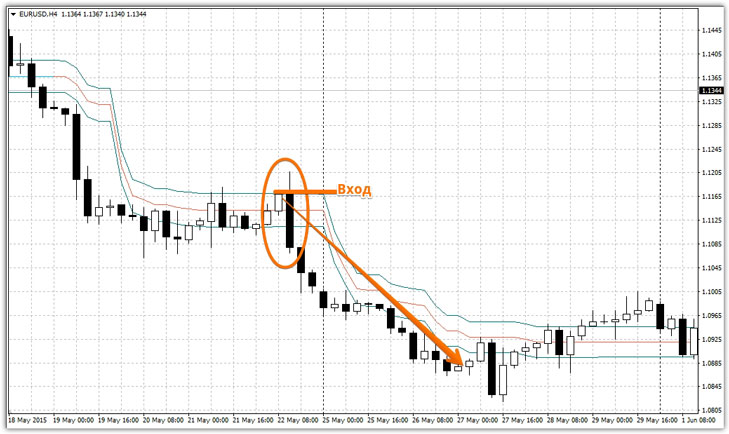
To enter a sell position, Ozymandias must create the following conditions:
1) The central line of red.
2) the price touched the upper boundary of the indicator (overlaps zone).
Example:
In conclusion, I would like to note that Ozymandias is a universal technical analysis tool that can act independently even as a trading system. The only drawback that can be noticed with the naked eye is the indicator lag.
However, this drawback is common to all trend instruments, the main task of which is to display the current trend without market noise.