Keltner channel indicator.
Another trend channel option based on a moving average, which serves as the primary reference point for 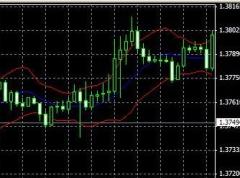 plotting two additional lines.
The channel's width directly depends on the average price for the time period over which it was plotted, allowing for optimal market volatility in Forex trading.
The script is based on the Keltner methodology, developed back in 1960 and successfully used for over 50 years, confirming its effectiveness.
Download the Keltner Channel indicator.
Once you've installed the indicator and launched it, a three-line channel appears on the chart, including a moving average and support and resistance lines.
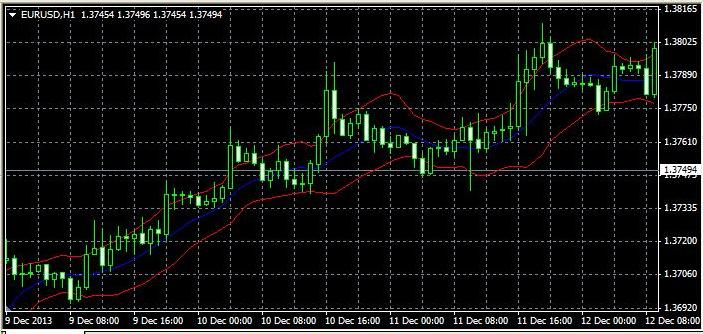
Support and resistance lines are highlighted in red, and the moving average is dotted blue. The visual display can be easily changed in the settings.
Settings.
MA_Period – the period length used in the calculations; the higher the value, the smoother the Keltner channel will be.
Mode_MA – the Moving Average mode; the default is 0, which is recommended.
Price_Type – the typical price indicator, which can be changed between 3 and 5.
Display – the channel line colors and thickness can be easily changed.
Trading with the Keltner Channel.
The simplest trading approach using this indicator is trend following.
Buy when the price is at the lower boundary of the channel and begins a sharp upward movement.
Sell when the price bounces off the upper boundary and steadily moves downward.
This takes into account the maximum and minimum price values in previous time periods.

