Pivot point indicator.
Pivot points have always been the most suitable places to enter the market; they are not easy to determine, so it is better 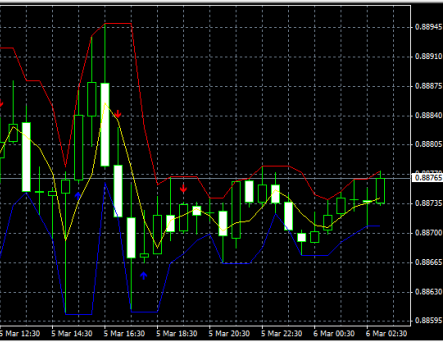 to use a special tool for these purposes.
The Pivot Points indicator is designed to identify price reversals. It captures both trend reversals and pullbacks, making it more effective.
In addition to trend reversal signals, the script draws three multi-colored lines on the chart, two of which act as support and resistance lines, and the third acts as a moving average.
Thanks to the variety of data available, using the Pivot Points indicator significantly expands your analysis capabilities. The chart clearly displays not only corrections and reversals, but also tracks the overall trend dynamics.
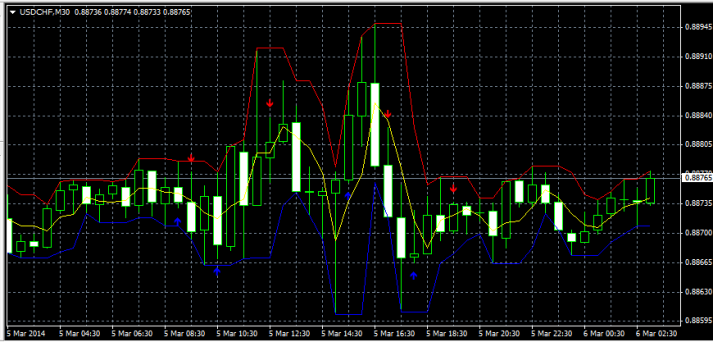
After installing the script in standard mode, you will find the following graphical constructions on the currency pair chart:
• Blue arrows - signal an upward trend, and accordingly are signals to buy.
• Red arrows - indicate a downward trend and can be signals to sell.
• Blue line - support line.
• Red line - resistance line.
• Yellow line - trend line.
The reversal point indicator is more suitable for use in short-term scalping, since not all signals indicate a global change in trend, which is important when opening long-term transactions.
The price channel also leaves much to be desired, but it serves only a supporting function when working with the indicator.
Download the Pivot Points indicator.
A full description of all settings is included in the archive, along with the program file itself. These settings will allow you to customize the script to your trading timeframe.

