Moving Average multi.
This indicator uses moving average analysis to determine the current trend direction and its origins.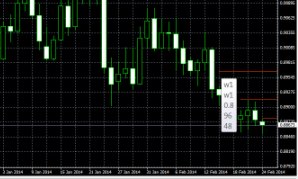
It works well across all timeframes and currency pairs, hence the "multi" prefix.
Unlike the standard Moving Average indicator, it doesn't display a single line, but instead displays multiple segments of different colors on the chart, characterizing the trend and its duration.
Working with this tool is quite simple; for maximum effectiveness, simply adjust the basic moving average parameters.
Afterwards, several segments of different colors will appear on your chart, in some situations the same color: • Green - there is an upward trend on this time frame . • Red - a downward trend prevails . • Blue - indicates that the market has currently entered a flat state.
For proper operation, it is recommended to adjust the following settings:
display_period – displaying the indicator line for a given time frame;
average_bars – the period of the “moving average” for the given period;
ma_method – smoothing method of the moving average:
0 – SMA,
1 – EMA,
2 – SSMA,
3 – LWMA;
applied_price – base price of the moving average
0 – close,
1 – open,
2 – high,
3 – low,
4 – median (HL/2),
5 – typical (HLC/3),
6 – weighted (HLCC/4);
line_color_up – color for an uptrend
; line_color_down – color for a downtrend;
line_color_flet – color that characterizes a flat market on Forex.
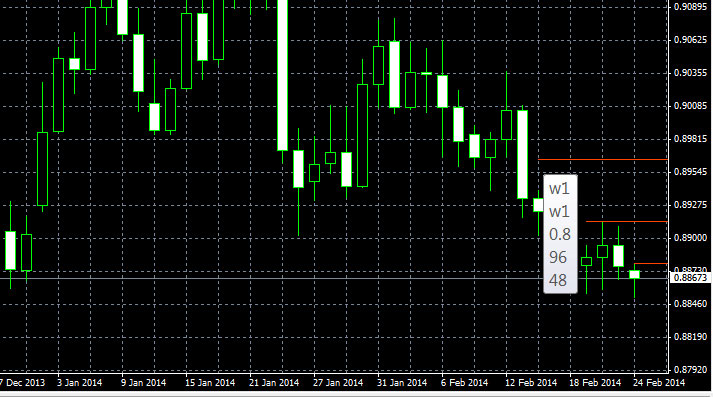
When you hover over one of the lines, a tooltip appears characterizing the level.
Download Moving Average Multi.

