Candle time indicator.
This tool tracks the candle lifespan or time frame duration, meaning you can find out how long a time frame lasts and how much time is left until it expires.
The candlestick time indicator can be useful for traders who consider the closing time of timeframes in their trading, as sometimes the price behaves quite predictably before closing.
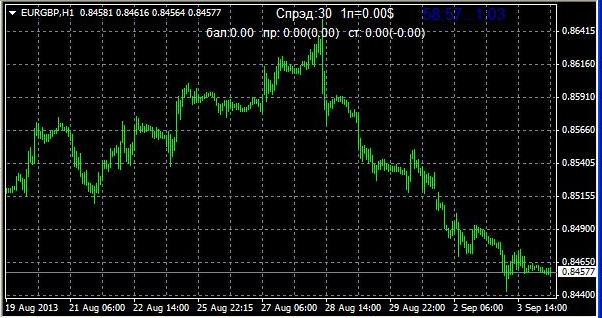
In addition to the above parameters, this script also displays information about the current spread for the trading instrument, the pip value based on trade volume, and the current balance. A more detailed description of all available functions is provided below.
Download the candlestick time indicator.
After downloading the tool, install it on the currency chart. To do this, copy the indicator file from the archive to the appropriate folder in your trading terminal, find it in the "Custom Indicators" menu, and proceed with the configuration.
First, change the nColor parameter—it displays the color of the displayed information. The default is blue. If your currency pair chart background is black, it would be more logical to set the text color to white.
Other settings can be left unchanged, but if you want to customize the candle time indicator, you can do so as follows:
lCountdown – 1 to enable, 0 to disable, time remaining until the end of the current time frame.
IInfo – enables the display of additional information, such as spread value, pip value, balance, and the financial result of the trade.
You can also check the box to display the indicator on all time frames, but this function didn't work for me; I had to repeat the settings for each time frame individually.
Overall, it's a very useful tool that will suit any trader using any trading strategy.

