Indicator of maximums and minimums.
This tool is designed exclusively for determining daily price lows and highs; all calculations are performed fully automatically and displayed on the currency pair chart.
The minimum and maximum indicator allows you to find out the highest and lowest price values on a daily time frame; calculations can be performed for a period of up to one month.
After downloading this indicator, copy it to your terminal folder, then restart the trader's terminal and proceed with the installation.
As usual, the tool is located in the "Custom Indicators" section. To install it, simply click on the "Trade Day" script and press OK. The program works fine with the default settings. However, if you still want to change them, I'll explain the main parameters below.
After installation, several squares will appear on your chart, indicating the high and low prices for each trading day. The number of days displayed directly depends on the scale and timeframe selected. Obviously, you won't see any information on M1; the timeframe should be at least H1.
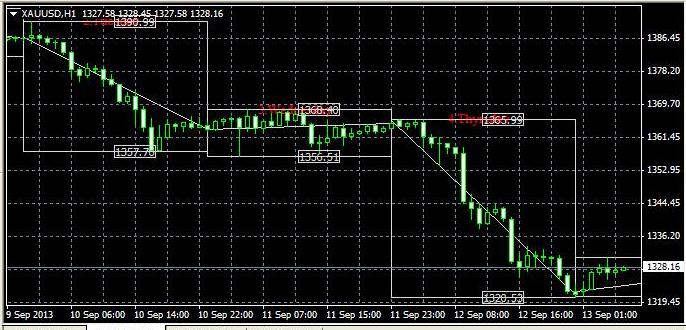
The minimum price for the day is displayed at the bottom of each square, and the maximum value at the top. The days themselves are shown in red.
Setting:
color2 – the color of the main lines and price values on the daily timeframe; gray by default.
Limit – the analysis time in days, set to 30 days.
Sho_bars – if this indicator is disabled, all the most important data will disappear, and only the number of days will be shown on the chart.
The highs and lows indicator, in addition to the main indicators, also helps to understand market volatility, as the support and resistance lines immediately show the width of the price range for each day.
In practical terms, the highs and lows indicator can be used in strategies such as breakout trading and trading within a price channel. The information obtained will also help determine when placing a take profit.
Download the highs and lows indicator.

