MACD Combo Indicator
It's no secret that visual perception of certain market processes greatly influences a trader's performance and productivity.
Often, beloved indicators, especially standard ones, have a rather complex signal recognition system.
This is why dozens, even hundreds, of different modifications of standard indicators can be found on various websites.
For example, traders don't want to watch moving averages, so they ask programmers to implement an indicator that displays the crossing moment with an arrow on the chart.
Hundreds of such modifications and adaptations are floating around on various Forex forums, and believe me, visualization really does make a difference to traders, helping them find the necessary signal much faster and easier.
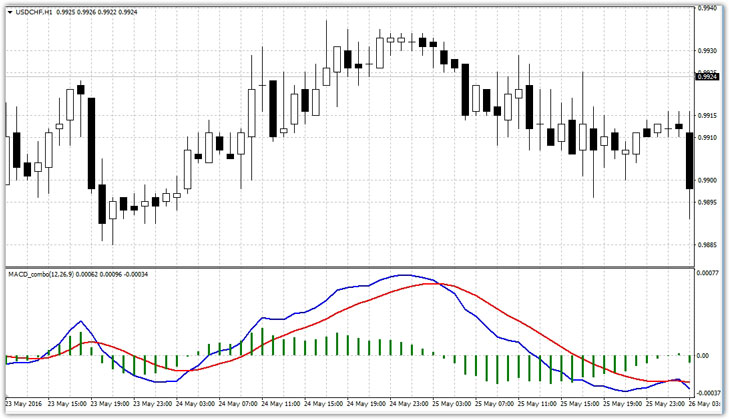
The MACD combo indicator, unlike its main analogue, uses lines to display the moment the histogram crosses level 0 and also displays the difference between the signal line and the MACD indicator line.
Thanks to a complex modification of the MACD combo tool, it has become an active part of various scalping strategies, and some traders use it on their own.
Installing the MACD combo indicator
Unlike its predecessor, MACD Combo isn't installed by default in MT4, so you'll need to download it at the end of this article and install it yourself. To do this, after downloading, you'll need to access your platform's data directory.
To do this, launch the Meta Trader 4 trading terminal and find "Data Directory" in the File menu. Once you open the directory, you'll see a number of folders. Find the "indicators" folder and copy the downloaded MACD Combo file into it.
Next, close the terminal folders and update the navigator panel. After updating, the MACD combo will appear in the list of custom indicators, so you can drag it to the chart of any currency pair.
MACD combo settings
: The MACD combo indicator, like its original counterpart, has the same settings, as the basic principle of this tool is a moving average with different periods, and the histogram we're used to seeing is the difference between specific moving averages.
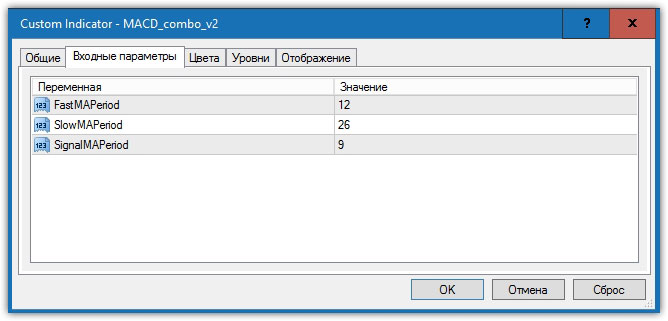
The settings contain only three lines: FastMAperiod, SlowMAperiod, and SignalMAperiod. In the FastMAperiod line, you can specify the fast moving average, in the SlowMAperiod line, you can set the slow moving average, and in the SignalMAperiod line, you can specify the signal moving average period.
It's also worth noting that the SignalMAperiod is represented on the chart by a red line. The settings are essentially the same as the standard MACD, so optimizing the indicator for a specific trading style shouldn't present any difficulties.
MACD Combo Signals and Applications:
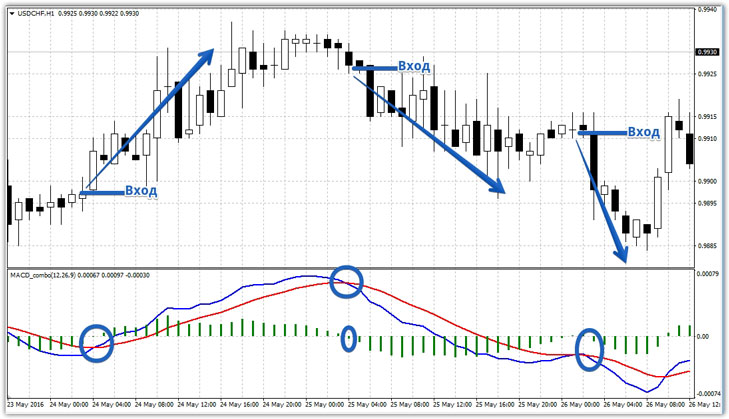
The first application is based on the intersection of two indicator lines or the 0-level histogram. This signal is the primary one, as the MACD has been modified to better capture this particular signal.
It's also worth noting that the intersection of these two lines typically occurs during a significant trend change, primarily when a market reversal occurs. So, a buy entry occurs when the blue line crosses the red line from the bottom up, and a sell entry occurs when the blue line crosses the red line from the top down.
Similarly, you can buy when the histogram crosses level 0 from the bottom up or sell when the histogram crosses level 0 from the top down. Both of these signals appear simultaneously, and an example is below:
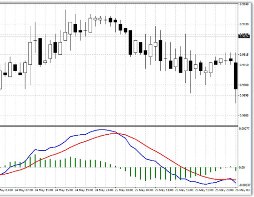
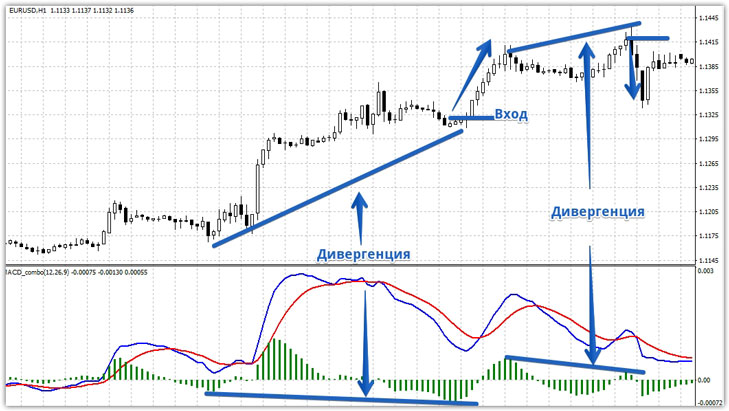
The second type of signal is based on the MACD Combo's ability to predict a potential price reversal using divergence. Divergence in Forex occurs when price readings diverge from the actual market situation.
For example, imagine you see a new high formed by the price this week, but at the same time, the histogram shows that this high is lower than the previous day. This difference in readings indicates a strong reversal in the market.
Typically, after detecting divergence, you should enter a position after the next bar of the MACD Combo histogram decreases or increases, confirming the emergence of a reversal. An example of MACD Combo divergence is shown below:
The tool can serve not only as a signal indicator but also as a trend and trade direction filter, filtering signals from other indicators when entering the market against the main trend.
Thus, a histogram above level 0 indicates an uptrend, while a histogram below level 0 indicates a downtrend.
In conclusion, it should be noted that the MACD combo, like its main counterpart, the MACD, is a multifunctional technical analysis tool. However, it is best to avoid using the script alone and combine it with another trend indicator.
Download the MACD combo indicator.

