SupDem supply and demand indicator
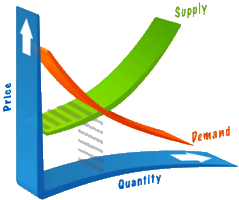
Forex trading is essentially no different from the market relationships we see in a typical grocery market. On the forex exchange, as in a market, there are buyers and sellers, and prices are regulated by the balance between supply and demand.
In the forex market, as well as in the stock exchange, one simple law has always held true, and will always hold true: "Sellers try to sell high, and buyers try to buy low."
While in real life you browse several counters and find a reasonable price for a product, in the forex market you also try to buy the asset at a more favorable price in order to profit from its growth.
In fact, demand always meets supply, so if you divide all market players into sellers and buyers, you can quite accurately determine supply and demand zones—specifically, the prices at which sellers want to sell currency and buyers want to buy it.
The SupDem indicator highlights supply and demand zones on the chart, allowing you to analyze market participants' desires and potential price movements.
Installation
The SupDem indicator is not included by default in the MT4 trading platform, so you should first download the indicator at the end of the article and install it on the platform.
To do this, launch your MT4 trading terminal and go to the File menu, then open the "Data Catalog." Once you have access to all the necessary folders, find the folder named "indicators" and drag the SupDem indicator into it.
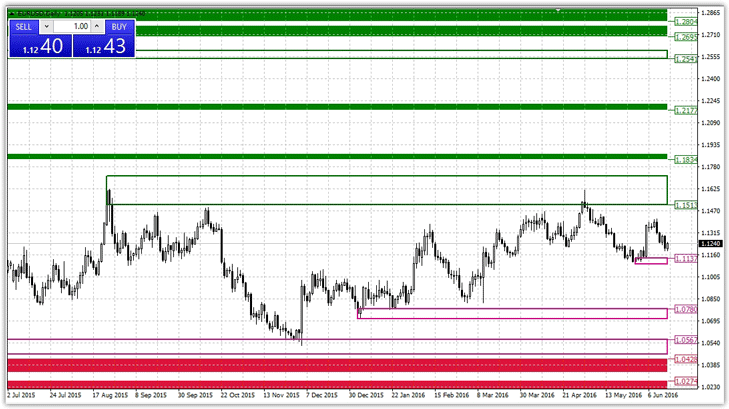
After closing the data catalog, refresh the navigator panel, and the SupDem indicator will appear in the list of custom instruments. To begin market analysis, simply drag the SupDem indicator onto the hourly or higher chart of any currency pair. The resulting chart will look like this:
Settings indicator SupDem
The indicator's author devised a rather complex algorithm for determining these zones, but according to many programmers who have developed dozens of redesigned versions, this tool builds its levels based on the Fractal indicator. The indicator's settings are primarily graphical.

Forced.tf creates a markup for a specific time frame. The default value is 0, so the indicator plots the markup on the time frame it's applied to. If you want the markup to appear on the hourly chart starting from the 15-minute chart, simply enter 15.
Draw zones controls the display of these zones on the chart. If you switch from True to False, the indicator will not display supply and demand zones on the chart.
Solid zones controls the display of zones on the chart. By default, the zone is drawn in a specific color, and if you disable this function, the indicator will draw unfilled rectangles.
The solid retouch function displays triggered zones on the chart, and the recolor retouch function enables a visual display of triggered zones and changes their color.
The zone strength function allows you to enable color changes when the price triggers weak zones, and the no weak zones function prevents the indicator from drawing these zones at all.
The Zone Fibs function allows the indicator to automatically plot Fibonacci levels between the supply and demand zones.
Practical application of SupDem:
On the chart, the green zones outlined indicate the location where sellers' pending orders are concentrated, specifically the supply zone. Buyers' desires, specifically the demand, are represented on the chart by the red and purple zones. The application principle remains the same: place a Buy Limit in the red zone and a Sell Limit order in the green line.
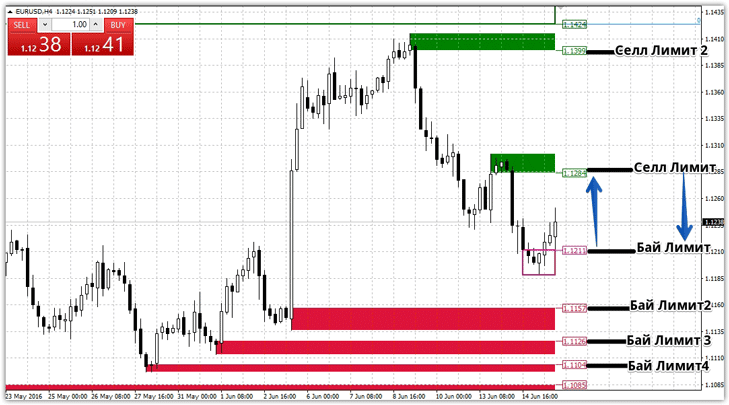
Trading is based on a classic rebound strategy based on support and resistance levels. Since the zones are quite wide, it is recommended to place a stop order at approximately 100 pips, with the target at the opposite zone. Example:
In conclusion, it's worth noting that the SupDem supply and demand indicator does an excellent job of visually displaying the zones we need. It's also worth understanding that this tool isn't just a signal indicator; it can also act as a filter, preventing you from entering trades near strong reversal zones.
Download the SupDem indicator

