SMA indicator
The main problem when analyzing and forecasting any currency pair is the wave-like structure of the market, which has an unordered and chaotic movement in the form of various noises.

The increased noise in the Forex market makes the chart chaotic and unpredictable, rather than linear, as we see in various textbooks when analyzing various technical analysis patterns.
These zigzagging market waves make it difficult for even professionals, let alone novice traders, to clearly see trends.
Therefore, the golden rule of trading only with the trend is extremely difficult to implement in practice and is practically impossible to apply without additional trend indicators.
The SMA indicator is the most popular trend indicator, which began to be successfully used in the early 1960s and remains relevant today. If we decipher SMA, we get Simple Moving Average, which simply means simple moving average.
So, if the market has such an ambiguous structure with a huge amount of market noise, then in order to look at the market from a different angle, we will need to simply smooth out this noise or, as the developers did, calculate the average price value over a certain time period.
This leads to an extremely simple formula for constructing the indicator: SMA = Sum of closing prices for a certain number of candles / number of candles. Thus, we have a simple arithmetic mean in the form of a line on the chart, which displays the average price value over a certain period.
Sma indicator in the trading terminal
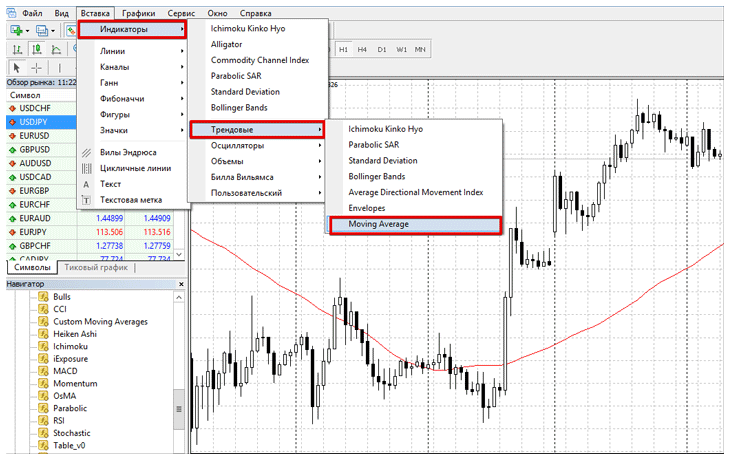
The SMA, or simple moving average, is present in every trading terminal without exception, and even mobile versions of trading platforms support this indicator. To add the SMA to a chart in the MT4 or MT5 trading terminal, click "Insert," " Indicators ," "Trend" in the top toolbar , and find "Moving Average" in the list. The indicator line will then appear on the chart:
Using the SMA indicator in practice
As we've already discussed, the SMA is a trend indicatorwhose primary purpose is to determine the trend. When applying this line to a chart, the first thing a trader should pay attention to is the slope of the moving average. If the line is pointing upward, the market is bullish, while if it's pointing downward, it's bearish.
Next, pay special attention to the price's position relative to the moving average, as the line can act as support in an uptrend or resistance in a downtrend, and vice versa.
So, if the price is below the moving average and touches it but doesn't break through, enter a sell position. If the price is above the moving average and touches it but doesn't break through, enter a buy position. See the example below: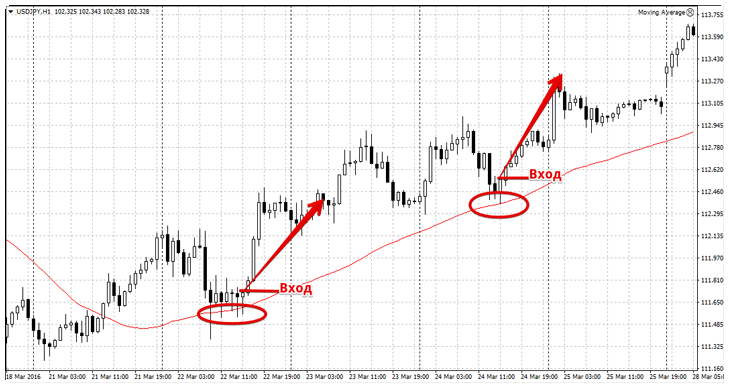
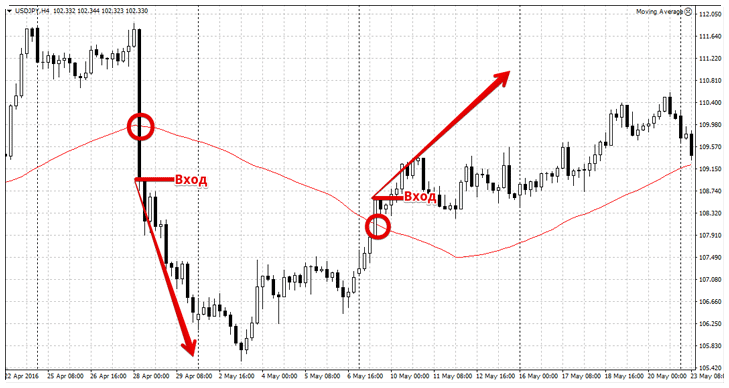
The SMA can also be broken by the price, signaling a market reversal. So, if the price breaks the line from the bottom up and settles below the SMA after the candle closes, enter a buy position. If the price breaks the indicator line from top to bottom and settles below it, enter a sell position. See below for more details:
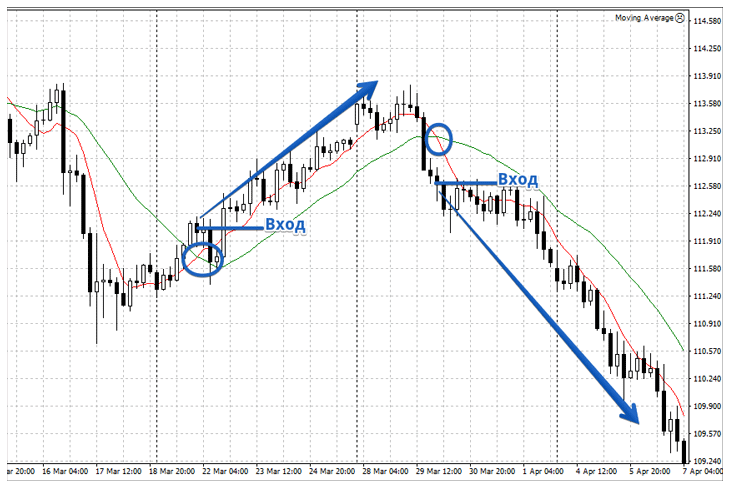
In addition to the two market entry signal options discussed above, the crossover signal of two moving averages is particularly popular. The trading principle is almost identical to the price-smoothing signal, but it involves two moving averages with longer and shorter periods.
A buy signal occurs when the slow SMA crosses the fast SMA from below. A sell signal occurs when the fast SMA crosses the slow SMA from above. For more details, see the image below:
In conclusion, I would like to note that, like any trend indicator, SMA gives a signal with a slight delay, and the more you smooth the price (increase the period), the greater the delay will be.

