McClellan Oscillator
The McClellan Oscillator technical indicator is one of the most popular tools for  studying market spreads based on the number of falling and rising candles over a given period.
The instrument itself was developed back in 1969 and was actively used in stock exchange trading.
While researching this oscillator, we encountered enormous difficulties, since, despite the instrument's popularity, it is practically impossible to find it on the Internet.
After poring over various Forex forums, both Russian and English, we came to the conclusion that the indicator, to put it mildly, has become a thing of the past. Moreover, when it comes to the Forex market, we were unable to find any evidence of its successful use.
Construction Features
The indicator is based on a rather complex formula, but in simple terms that are understandable to most, it's based on the difference between a fast and slow moving average with a period of 19 and 39. You can see the formula itself in the image below:

Installing the indicator
As we've already noted, finding the McClellan indicator for MT4 in its pure form is virtually impossible. However, on one of the foreign forums, we found an incomplete version of the tool, which is tailored to only one type of trading signal, rather than the two types described in the book.
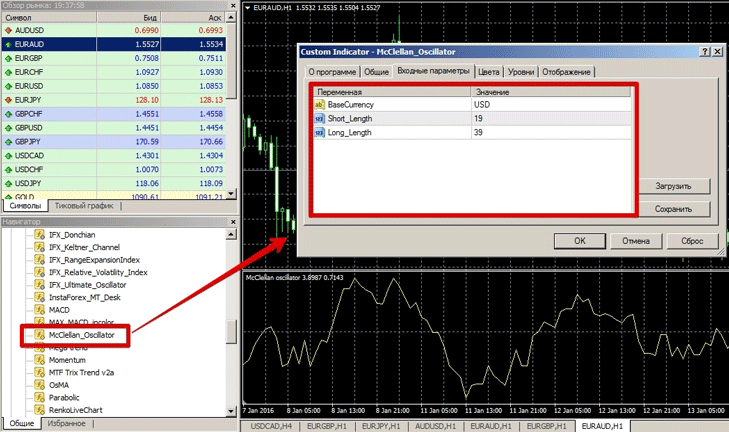
The installation process itself is no different from installing any indicator on the MT4 trading platform. Download the McClellan oscillator at the end of the article and, using the data directory in your terminal's file menu, place it in the indicators folder. After updating, drag the indicator onto the chart in the navigator panel. A settings window will appear:
Application options
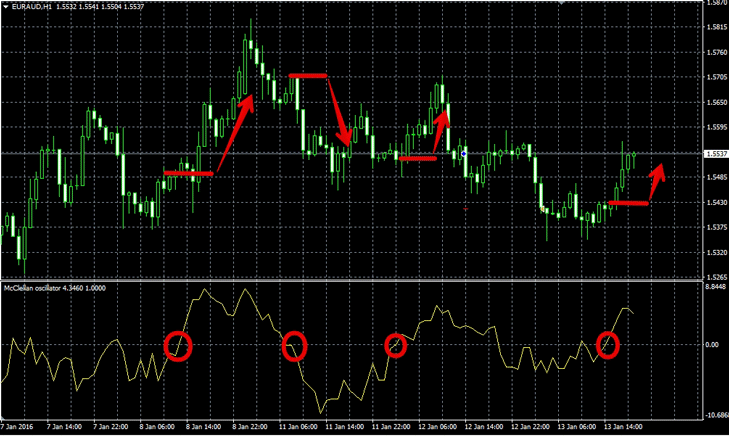
When using this version of the indicator, two types of signals can be considered. The first type occurs when the signal line crosses zero, while the second is based on a typical pattern of all oscillators: divergence.
So, regarding the first type of signal, we enter a buy signal when the yellow line crosses the 0 level from the bottom up, and a sell signal when the indicator line crosses the 0 level from the top down. For more details, see the image below:
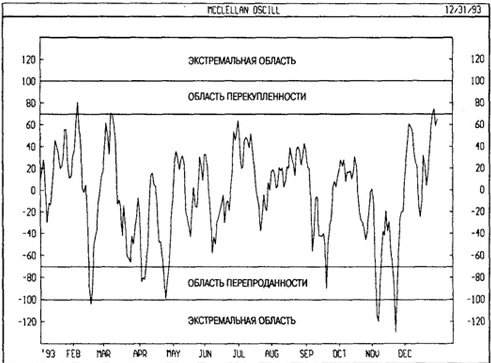
 Also, if you trade through specialized stock exchange trading platforms, they usually have this indicator built in by default. The full version of this tool includes additional levels, often referred to as overbought and oversold levels.
In terms of signals, you should sell when the indicator line exits the oversold zone, and sell when the indicator line exits the overbought zone. The image below clearly shows these zones:
 To sum it up, it can be clearly stated that the McClellan indicator does not provide ultra-precise signals, but it suffers from all the shortcomings inherent to any indicator from the oscillator group.
Therefore, it is not recommended to use it alone, but rather in combination with other effective technical analysis tools.

