Murray Indicator – Trading Features
The Murray Indicator is a universal technical analysis tool based on the world-famous Gann trading strategy, the effectiveness of which has been recognized by generations of traders.
 Thomas Murray significantly simplified the approach to trading using Gann levels, taking as a basis his fractal theory of market construction and using mathematical calculations to identify a coordinate system for each fractal.
Murray, like Gann, believed that the market consists of fractals, which have different sizes but the same shape.
In many textbooks, you'll find charts constructed using squares. According to Murray, the market consists of specific price fluctuations that can be squared.
Considering that each of the fractals is a separate whole from which the set is composed, Murray created an indicator that makes markings at important levels for each of the squares, and the analysis of each occurs separately.
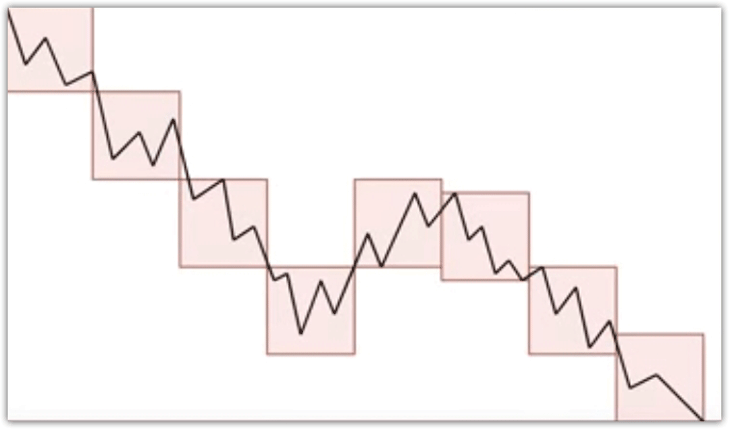
In the picture you can clearly see the whole essence of fractal theory, and the extreme Murray levels are the boundaries of a certain square.
Installing the Murray indicator
Before we begin examining the indicator's features and price forecasting method, you need to install it in MT4. To do this, download the indicator file and use the File menu to access the platform's data directory. You'll see the MQL4 folder, which contains a folder called "Indicators.".
Place the downloaded file in this folder and update the installed element in the Navigator panel. Given that this tool is a purely mathematical approach to market analysis, it can be applied to any currency pair or stock; however, it is recommended to conduct analysis on higher time frames.
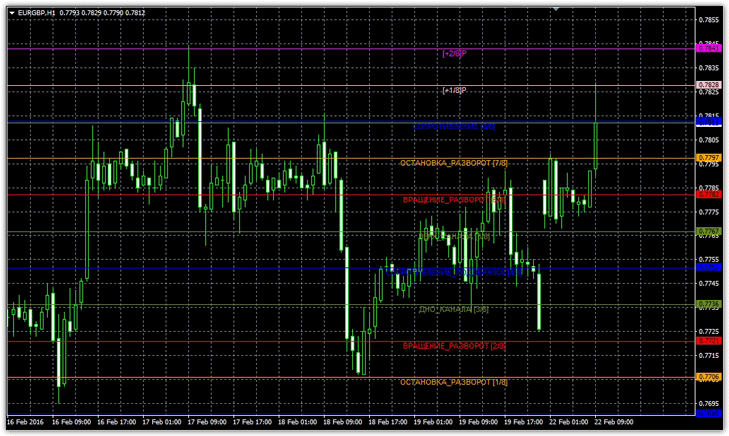
Move the indicator to any currency pair, but with a time frame no lower than hourly. You should see something like this:
The meaning and importance of each Murray level
Thomas Murray assigned different meanings to his levels, with the distinction being made based on their impact on price. Thus, the Support (0/8) and Resistance (8/8) levels are the strongest of all those presented on the indicator screen.
The most interesting thing is that these two levels are the boundaries of the fractal we mentioned at the very beginning. Most often, the price repeatedly bounces off these levels, but if they are broken, the indicator will alert you to the formation of a new square, which will undoubtedly lead to strong price movement.
The 7/8 and 1/8 levels, which the indicator calls "Stop/Reversal," have an order of magnitude less impact on price than the 0/8 and 8/8 levels and are often ignored by traders. However, this level has the distinctive ability to signal a reversal during a strong price surge.
So, if the price slowly and gradually descends toward these levels, they act as a guide to the subsequent levels of 0/8 and 8/8. If you observe a strong price surge and a price stop near 7/8 or 1/8, then there's a high probability you should expect a reversal from these levels in the opposite direction of the main movement.
The 6/8 and 2/8 levels are called rotation or reversal levels. Unlike the previously discussed levels, they have little influence on the market, but they often act as turning points.
The fact is that there is a price channel in front of these levels, after breaking through which the price tends to 6/8 and 2/8, after which it tends to balance out, pushing off to the central line of the channel.
Levels 5/8 and 3/8 are the top and bottom of a price channel that forms around the price with a central level of 4/8. As with any trading within a channel, its boundaries act as a support for pushing the price toward the opposite boundary of the channel, which undoubtedly provides a number of counter-trend entry signals.
The 4/8 level is the main support or resistance line, depending on the price position. It is one of the most important levels at which various price reversals occur.
Murray's Regularities and Patterns
Many traders use this indicator as support and resistance lines depending on their significance, but few know that the indicator draws various patterns that provide a forecast of possible price movements.
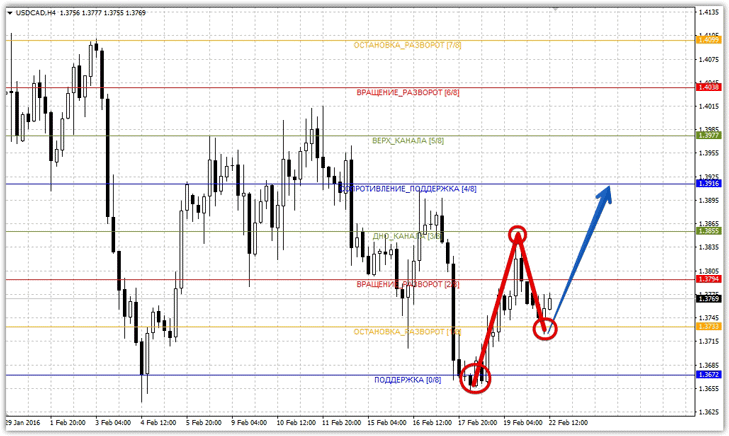
Pattern 0/8-4/8-1/8 with target 8/8
This pattern consists of three dots at levels 0/8, 4/8, and 1/8, which typically lead the price to level 8.8. The price doesn't necessarily have to stop at these levels; a slowdown of a couple of points from these levels is sufficient. To understand the pattern, I suggest looking at the image below:

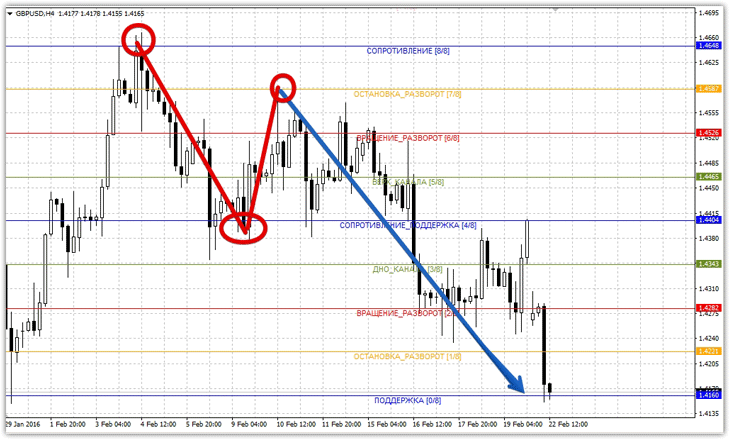
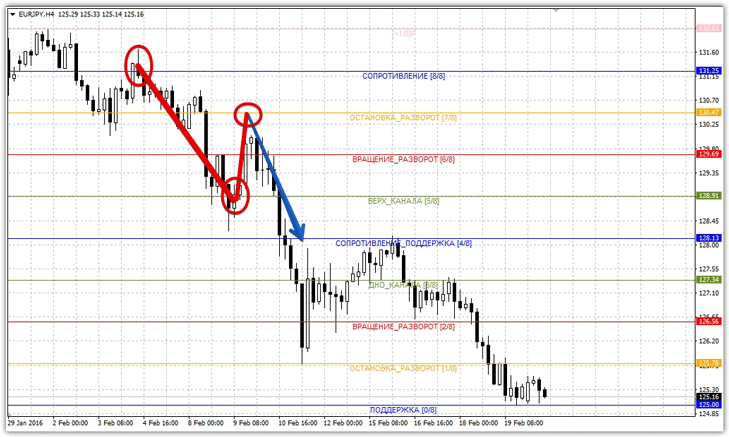
Pattern 8/8-4/8-7/8 with target 0/8
This pattern is a mirror image of the 0/8-4/8-1/8 pattern with a target of 8/8. An example of a mirror image partner for a sell entry is shown in the image below:
Pattern 0/8 – 3/8 – 3/8 with a target of 4/8
The pattern is formed by touching three important levels: 0/8, 3/8, and 3/8. The main goal is a price rebound against the main trend to the 4/8 level. Unlike previous patterns, the range is much smaller, and the target is the midpoint of the range. For clarity, see the image below:
A mirror image of the 0/8, 3/8, 3/8 pattern with levels of 8/8-5/8-7/8 with a target of 4/8. See the image below for an example:
In general, each trader chooses for themselves how to use this indicator and construct their signals. However, if you want to trade strictly according to Murray, then patterns are the basis for entering the market using this indicator.

