The ZigZag indicator is a master of trend detection
Market noise creates significant interference in determining the global trend. Many beginners 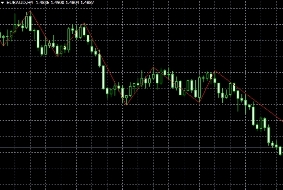 experience significant difficulty identifying trends, as the market's turbulent movements simply don't allow for a quick visual assessment of the global direction, with every trough or peak interpreted as a new trend direction.
Let's be honest, even seasoned traders often misjudge the direction of a trend during trading, as sharp, strong impulses against the main trend, which can amount to up to 50 percent of the current trend, can mislead even the most seasoned traders.
The ZigZag indicator is a so-called non-trading indicator, which aims to show the current market situation rather than provide specific signals for entering a position.
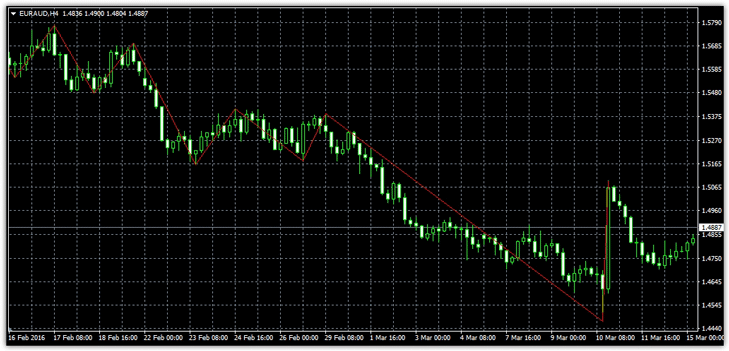
The peculiarity of the script is that it connects extreme extremes with lines, thus smoothing the price movement between selected local minimums and maximums.
Plotting on a chart
ZigZag is a trend tool that has been implemented into the MetaTrader 4 trading platform by default.
The developers have categorized this tool as a custom indicator, so to add it to a chart, go to the navigator panel, open the indicators section, and find the custom category. Then, simply drag the script onto the chart.
ZigZag settings
Once you enter the ZigZag settings, you will find only three parameters that form the basis for constructing the indicator.
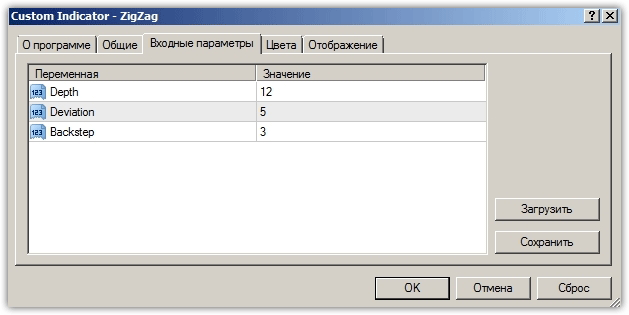
The Backstep line specifies the minimum number of bars or candles that are required for the indicator line when it is plotted.
The Deviation line specifies the minimum distance as a percentage between the local minimum and maximum. The Depth line specifies the number of bars the indicator needs to draw a new extreme.
ZigZag Applications
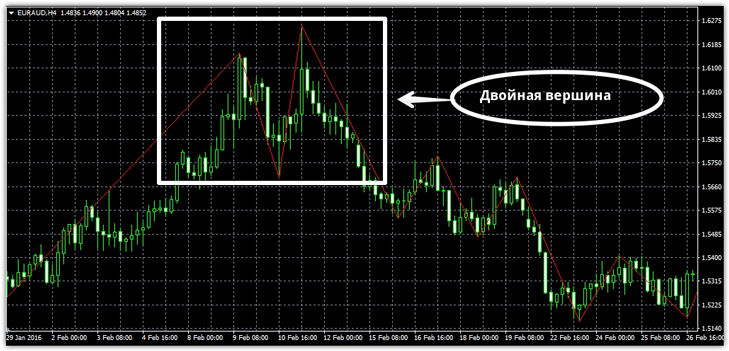
The ZigZag indicator is an excellent aid in recognizing various reversal patterns. Connecting lines between extremes make it easy to recognize patterns such as Double Bottom, Double Top, Triple Bottom, and Head and Shoulders.
An example of identifying figures is shown in the image below:
In addition to identifying graphical patterns through smoothing, ZigZag is simply the best assistant for traders actively using Elliott Wave Theory.

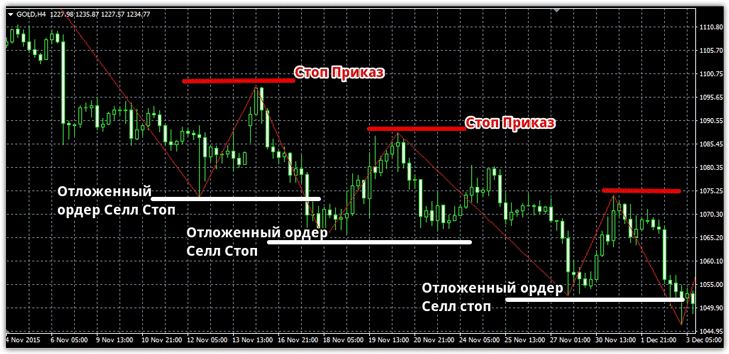
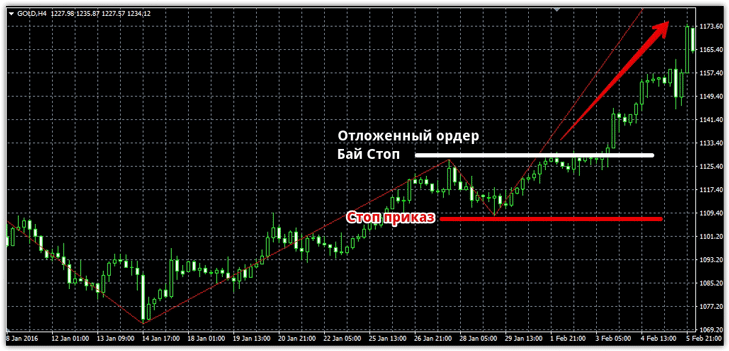
Despite the indicator's auxiliary function, traders have noticed a rather interesting pattern, which they call the ZigZag pattern.
The essence of the pattern is to place a pending sell stop order at a local minimum formed by the ZigZag indicator, and a buy stop at a local maximum formed by the ZigZag indicator.
Thus, this approach resembles a breakout trading strategy, where all positions will be opened strictly in the direction of the main trend.
An example of a pattern with a sell signal is shown below:
An example of using the ZigZag pattern with a buy signal:
Many novice traders also often have difficulty setting stop orders, which, according to almost all training textbooks, must be set at local minimums or maximums.
The indicator completely solves this problem, since its construction comes down to connecting the points of local minimums and maximums.
Thus, the tool can be used not only to find local minimums and maximums, but also to help build various graphical analysis tools for which it is very important to find these levels, such as when using the Fibonacci Fan or Fibonacci Levels.
In conclusion, it can be noted that the ZigZag indicator is not only an excellent tool that allows you to filter out market noise and see the current trend, but can also perform various additional functions.

