What is the Kelly formula and how is it used in trading?
In any investment area, capital management is always an integral part of the process of profitable investment of money.

There are quite a few experts who argue that a good trading system may not contain any elements of money management.
But in practice, ignoring money management rules usually results in large losses or the complete loss of the deposit.
Capital management is most simply understood as the development of an effective plan that allocates an investor's available funds taking into account risks and potential returns.
Kelly's formula
The Kelly formula, also known as the Kelly criterion, is a mathematical formula named after its founder, John Kelly:

While working at AT&T's Bell Labs, Kelly developed a mathematical formula for his work, originally intended to combat long-distance telephone interference.
After some time, the Kelly formula began to be used in calculating horse racing bets, the main goal of which was to select horses to maximize profits with minimal risk. A little later, the formula was also applied to other areas of the gambling industry.
After this approach proved its effectiveness, it began to be used in financial markets. Even financiers such as Warren Buffett and Bill Gross began using the Kelly Formula in their work.
Later, investors used the Kelly formula for capital management in many different financial markets to determine the percentage of capital per trade to optimize long-term profits. Some financiers, such as Warren Buffett, Bill Gross, and Edward Thorp, successfully used the Kelly formula.
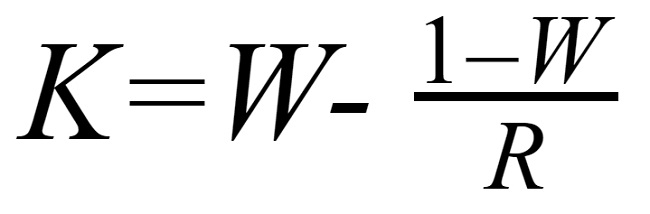
Kelly's formula:
Kelly % = W – [ (1 – W) / R ], where:
%: percentage of the depositthat can be involved in the transaction
W: win rate, the probability of winning based on the total number of trades.
R: Reward:Risk Ratio, the ratio of average profit to average loss per trade.
For example, if you've traded a total of 50 orders in your trading history, the number of winning (profitable) orders is 30. The resulting win ratio (W) is 30/50 = 0.6. On average, each winning trade will earn you 120 pips, and on average, each losing trade will lose you 75 pips. Then, the reward-to-risk ratio is 120/75 = 1.6.
Let's add the data into the formula and get Kelly% = 0.6 - [(1 - 0.6) / 1.6] = 0.35.
How to determine the value of W and R.
To calculate the W value using this example, you need to determine the total number of transactions in your history. If you've been trading for a long time, you can use cycles such as 1 month, 3 months, 6 months, or 1 year... or you can choose a specific number of orders, say, around 50. If you're scalping, you may need to use a larger number.
Once you have the total number of trades, you determine how many were winning, from which you can calculate the W value.
With R, you can also easily calculate this ratio by adding up all the winning pips (or the amount of profit) and then dividing by the total number of winning pips, adding up all the losing pips (or the amount of loss) and then dividing by the total number of losing trades, then dividing these 2 averages together to get the R result.
Traders who already have a stable trading system built on the ratio between take profit and stop losscan also use this ratio as R.
How to use Kelly formula?
How do market traders use this formula? Will they adhere to it or adapt it to each market and simply use the formula's results as a benchmark?
The fact is that we cannot determine the truly real probability of winning, nor the most accurate ratio of profit and loss.
Firstly, the probability of winning at one point in time will be different from another, the ratio of profit and loss in normal market conditions will be different than in market volatility.
Secondly, both the win probability and the profit/loss ratio are average values, so of course they will not accurately reflect real values and will change over time.
Thirdly, because the formula has a fairly wide application – sports betting, casinos, stock trading – its versatility does not provide a 100% result.
Therefore, traders often use the Kelly formula only as a reference value, while modifying the result to better suit their own conditions and the market.
If you have calculated the Kelly ratio yourself, you can use it to plot a graph showing the long-term risk-reward ratio.
Typically the graph looks like this:
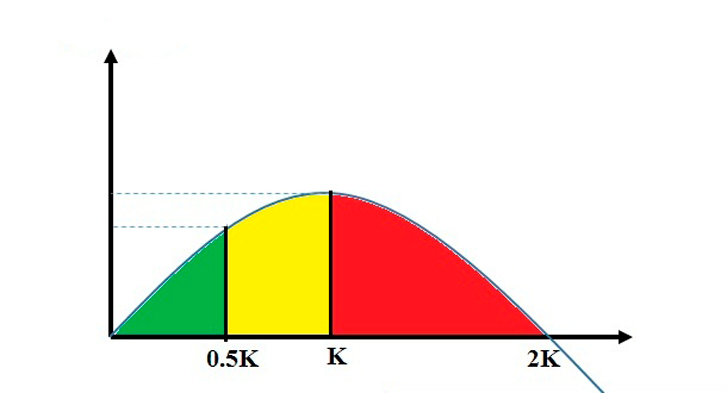
If we use the Kelly ratio correctly, achieving profitability is more likely over the long term. But if your Kelly ratio is too high, even if profitability remains high, the risk will be too high.
The standard Kelly ratio is usually 0.25 (25%), this ratio is for the average trader with a 50% win probability, a 2:1 profit/loss ratio (profit must be at least twice the bet) taking into account the risk).
If your Kelly ratio is greater than 0.25, you should consider lowering it.
On the graph you can divide it into 3 areas marked with 3 different colors.
The 0 to 0.5K range: This is considered a relatively safe zone. Safety doesn't mean no risk, but the risk will be low and you'll still be able to achieve your desired profit margin. 0.5K is an excellent ratio in this safe zone.
The 0.5K to K zone is considered the risk zone. If you use the Kelly ratio in this zone, your profit will be optimal, especially with the correct K ratio. The return is slightly higher, but the risk is double that of 0.5K.
Zone > K: The optimal profit margin in the long term decreases, while the risk increases, so this zone is considered the zone of greatest risk.
The standard Kelly ratio is 0.25, but each trader will have a different value depending on the individual and market conditions.
For example, Edward Thorp also advises reducing the position size (decreasing the equity ratio or decreasing the Kelly ratio) during market volatility and increasing it again when the market stabilizes.
Find the ratio that works best for you, but keep in mind the Kelly principles above to minimize risk.

