Volume indicator for cryptocurrency trading
Cryptocurrencies have long been a familiar exchange asset; they can be found on many trading platforms.
Despite the virtual nature of digital money, they lend themselves well to technical analysis, which allows various technical analysis tools.
One such tool is the volume indicator, which tracks changes in the volume of open trades for a selected asset.
Knowing how volumes change allows you to decide how strong an existing trend is or to confirm a breakout of a price level.
The script, appropriately named "Volumes," allows you to find out the volume of transactions conducted on any exchange asset, including cryptocurrencies:
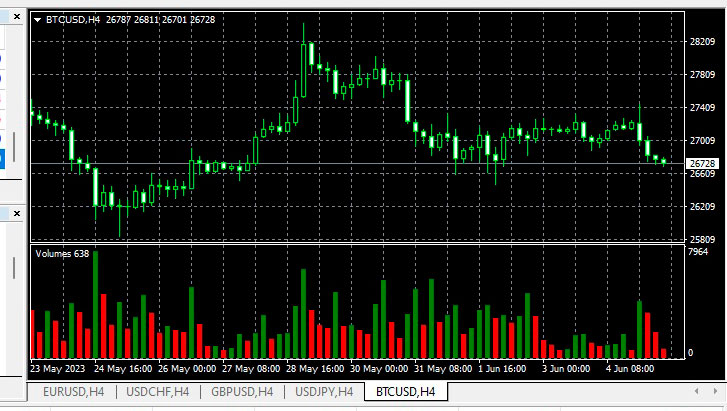
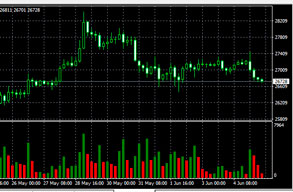
This tool, after adding a cryptocurrency pair to the chart, displays information about the trading volume of this cryptocurrency in the form of a histogram.
Each histogram bar corresponds to one time frame, meaning if you select a time interval of one hour in the chart settings, the bar will show the total number of trades for one hour.
Green bars indicate that trading volumes are increasing compared to the previous time period, while red bars indicate a decline in total volume.
To understand the full picture, it is best to open several time periods at the same time, for example, M15, M30 and H1, so you can see the current trend of changes in volumes.
Volume indicator settings for cryptocurrencies
The script has a minimum number of available settings:
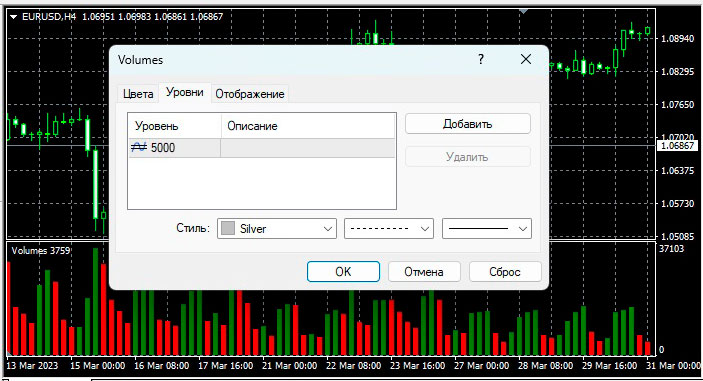
When using it, you can set the color of the histogram bars and set the levels that are important to you, which will be used for your strategy.
The volume information in the Volumes indicator is obtained from data provided by the broker. Brokers using MetaTrader 4 provide tick data (price and volume) from the market.
This data is collected and aggregated for each bar of the chart, and the result is displayed as a histogram in the Volumes indicator.
It's important to note that volumes in MetaTrader 4 are displayed based on tick data, not actual volumes in monetary terms. However, this doesn't prevent the resulting information from being effectively used in technical analysis of the cryptocurrency market.
If you need information on actual trading volumes for cryptocurrency, the article explains where to find this information: https://time-forex.com/kriptovaluty/obemy-kripto
How to use the Volumes indicator in practice is described in detail in the article - https://time-forex.com/tehanaliz/obemy-v-birzhevoj-torgovle
If the described indicator does not suit you, you can use an alternative development - https://time-forex.com/indikators/indik-volumes

