Cryptocurrency indicators, market analysis, and trend detection
The cryptocurrency craze, which has captivated a huge number of people, has once again proven that the market simply cannot tolerate unprofessional and superficial traders. 
The enormous hype surrounding record growth, spread by the media and on various YouTube channels and bloggers, attracted a huge number of ordinary people to the market.
Information poured in from all sources about the need to buy cryptocurrency.
The most interesting thing is that people couldn't even imagine that the cryptocurrency market could move in any direction other than upward.
Indeed, almost everyone managed to profit from the hype, but no one is talking about how many lost huge amounts of money after the market suddenly reversed course.
In reality, cryptocurrencies are practically no different from any other trading asset whose movement traders speculate on.
Choosing a Cryptocurrency Indicator: A Brief Introduction to Some
Beginners trade through dubious exchanges that only trade digital currencies. They typically lack any platform other than a bare price chart. Meanwhile, most reputable forex brokers offer cryptocurrency trading not only safely but, most importantly, through a platform that includes cryptocurrency indicators. As we've already noted, this market is actually very similar to the forex market, with the exception of volatility indicators . However, the underlying price movement structure remains the same as for other assets.
Therefore, all scripts in the MT4 trading terminal, as well as custom tools created for this platform, are the same cryptocurrency indicators.
Naturally, with the vast number of scripts available, it can be difficult at first to choose the right one for you. Therefore, we suggest familiarizing yourself with the key ones worth paying attention to.
1. Bollinger Bands.
Bollinger Bands are one of the most suitable indicators for cryptocurrencies. This indicator is inherently an extremely versatile tool, allowing it to be used both in flat markets, which we've recently observed in this market, and in trends.
The script itself perfectly displays the price range within which the digital currency moves.
The range can be traded both on breakouts of its boundaries, if it's an established trend, and on rebounds from its boundaries, especially in a sideways market.
 Therefore, a buy position should be opened when the price touches the upper boundary, and a sell position when the price touches the lower boundary of the range. The central line will allow you to clearly assess the global market direction without any noise.
Learn more about Bollinger Bands - http://time-forex.com/tehanaliz/polosy-bollindgera
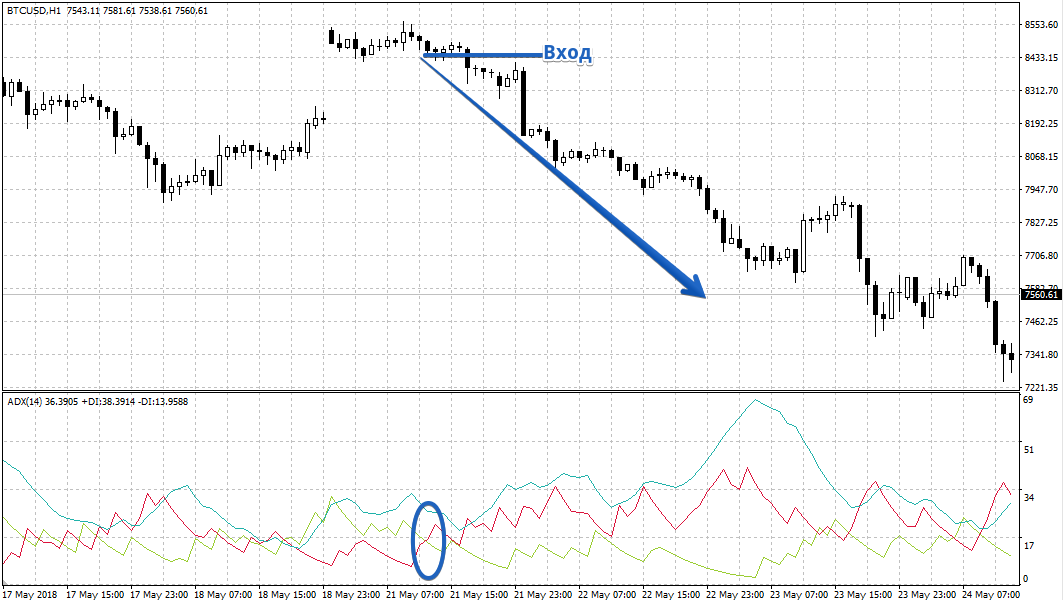
2. ADX
ADX, like the Bollinger Bands described above, is also a comprehensive trend indicator.
Its key advantage when applied to cryptocurrency is its unique ability to determine trend strength, something that other instruments cannot boast. ADX also perfectly shows entry points when a short-term trend changes.
So, if the indicator's green line crosses the red line and moves below it, we open a sell position, and if the green line crosses the red line and moves above it, we open a buy position.
The blue line of this instrument is a measure of trend strength. The higher this line is when the signal appears, the stronger the trade potential, since the signal appears at the peak of the trend.
In conclusion, it's worth noting that the digital market is just as unpredictable as the foreign exchange market.
Therefore, those new to this asset class should remove their rose-colored glasses and finally understand that effective trading can only be achieved using a variety of tools, especially cryptocurrency indicators.
You can download a trading platform with pre-installed scripts from one of the cryptocurrency brokers - https://time-forex.com/kriptovaluty/brokery-kriptovalut

