
GUI-Robot – automatic trading without programming knowledge
The modern realities of stock trading are such that programmed algorithms have almost completely pushed traders away from manual trading.

As a rule, in modern realities, a trader is assigned the function of monitoring and confirming signals, as well as a wizard who will promptly make changes to his pre-programmed algorithm.
However, creating an autonomous algorithm that can duplicate you and your strategy costs quite a lot of money, not to mention the fact that it is quite difficult for a programmer to explain what you want, since he writes programs and has nothing to do with trading on the stock exchange.
Exhausted nerves and wasted money are just a small part of the troubles that you have to face if you yourself do not speak a programming language. Of course, you can spend years learning to code, but there are other ways to go.
This platform contains two unique modules, namely GUI-Robot and iScanner, which allow you to implement trend strategies and also receive signals to enter the market using graphical and technical analysis.
You can also not only create your own trading algorithms, but also use others’ ones, which have shown results on the accounts of other traders of the company.
Launching GUI-Robot
In order to run GUI-Robot you must be the owner of the iTrader trading platform, which can be downloaded and installed from some of the brokers. After you have launched iTrader, pay attention to the top line and click on “Order”.
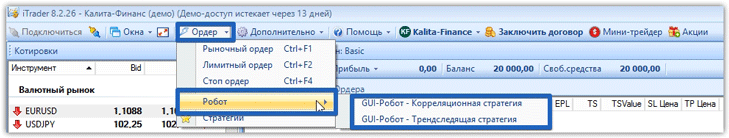
In the menu that appears, select the robots section.
Two GUI-Robots will appear in front of you, namely for a strategy based on correlation or trend following. Choose the option that you would like to implement. GUI-Robot and strategies
The iTrader developers implemented GUI-Robot by dividing it into two global strategies, namely correlation and trend.
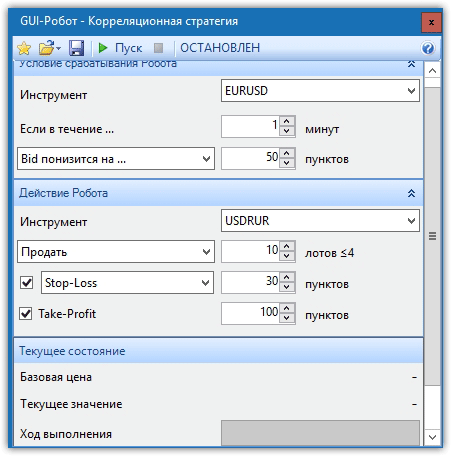
After launching a correlation strategy, in the settings you will need to indicate the asset on the basis of which the comparison and the identified pattern is made, as well as the asset on which operations should be carried out. From the conditions for opening a transaction, you can specify how many points the asset will decrease or increase per unit of time, so that GUI-Robot opens a transaction in a certain direction with a given stop order and profit.
This GUI-Robot allows you to build strategies based on correlation , but you must find these patterns yourself.
The second GUI-Robot allows you to implement trading strategies based on a number of standard technical indicators.
If we talk about conditions, this robot allows you to fulfill the conditions “If the indicator crosses above” or “If the indicator crosses below”, which is suitable for implementing strategies based on such indicators as RSI, Stochastic, ADX, AO, Envelope, MACD Histograme, Line, Willams Percent Range. To program a specific action, first specify the instrument on which you will trade.
Next, select an indicator and decide on the condition. In the second forty conditions, indicate a specific level. the RSI indicator in the first line , and the Suport Line indicator in which set level 30 in the second line. To buy, do not forget to set in the conditions “If the indicator crosses from below » and also select the action buy or sell.
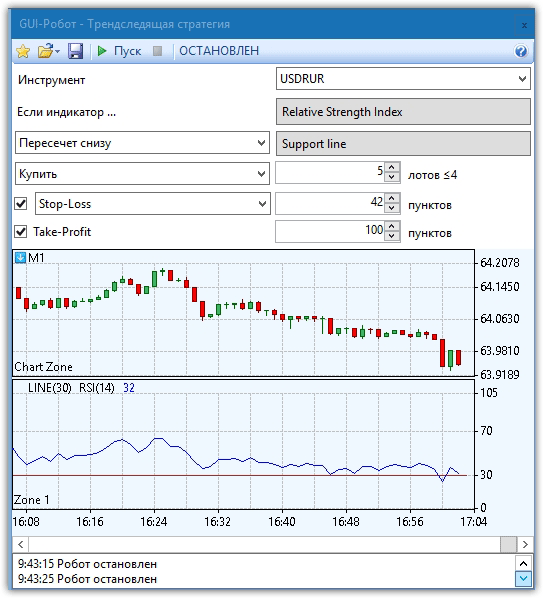
After you set the action, specify a stop order and profit for the robot and click “Start” for GUI-Robot to start trading.
iScanner
In addition to automation and creation of automatic algorithms, the developers have implemented iScanner, thanks to which you can receive audio signals for the most common candlestick patterns, technical analysis indicators and a number of price movement patterns.
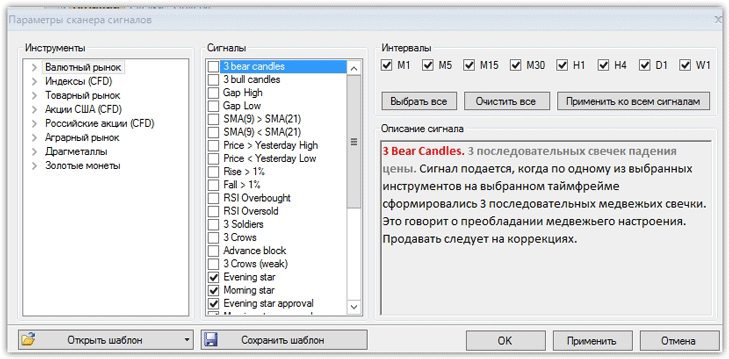
To turn on a sound alert, first select an asset, namely a currency pair, share, index or precious metal, as well as the interval at which trading and signal search will take place.
From the signals you can choose the following candlestick patterns: Three Crows, Three Soldiers, Evening and Morning Star, Absorption.
You can also turn on an alert when an ascending and descending gap appears, a breakdown of yesterday's minimum or maximum, a breakdown of the yearly and monthly levels, when the price falls or rises above one percent, as well as when the price rises or falls rapidly (the size of the candle is significantly larger than the previous ones). In addition to candlestick and graphical analysis, you can include signals based on technical indicators, namely when leaving the overbought and oversold zones of the RSI, when two moving averages cross, when the MACD histogram the signal line, as well as a number of signals based on other technical indicators.
In conclusion, I would like to note that GUI-Robot and iScanner can significantly simplify the trading process, as well as receive signals based on basic models of both technical and candlestick analysis.