Total Position Indicator
Surely, each of you has dreamed of peering beyond the market, seeing where traders stand, and 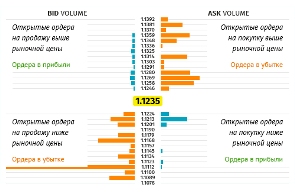 which direction the majority of players are aiming. Indeed, if you could master such valuable information, you would always be able to analyze the crowd's logic, their behavior, and predict potential price movements in the short term.
Broker Amarkets is the first to provide such information for general review to its clients.
Of course, you won't be able to get information about the order values of all traders, because even the broker doesn't know this, but you can always see which way Amarkets clients are trading and draw conclusions based on the information received.
You could probably argue that a handful of clients at a single brokerage firm have no impact on the multi-billion dollar flows that drive prices. While your arguments are certainly valid, even with this information, you'll be able to discern the underlying trend, as all traders share common trading characteristics, we all learned from the same books, and we use the same fundamental indicators.
Based on data collected by the brokerage company Amarkets on clients' open and closed orders, the Aggregate Position Indicator was created. Its essence lies in the fact that a price range is generated for different groups of traders, within which aggregate positions in one direction or another are marked.
The tool itself, with its full functionality, is available to all clients in their personal account, so you don't need to install it on the trading platform.
To find the indicator on the main page, go to the Laboratory section and click on "Total Position Indicator." Once you launch it, the indicator itself will appear, divided into two halves. The first half is called Bid Volume and displays sell orders. The right half is called Ask Volume and displays buy orders. A diagram marks traders' orders at specific price levels.
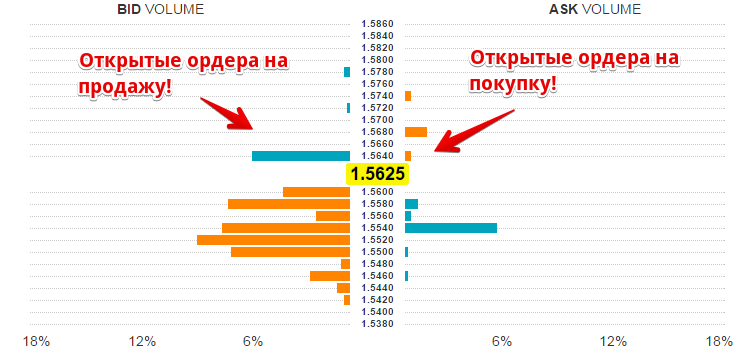
You can also select any currency pair and time frame used by traders. It's worth noting that the longer the time frame you select, the wider the price range over which clients' open orders will be displayed. The indicator highlights the current price in bright yellow, and it's typically located in the middle of the range.
The developers of this indicator ensured that users can easily recognize its readings. For example, if the chart is blue, it means open orders are profitable, while yellow means orders are losing money. Based on these readings, you can see how the crowd is behaving and avoid becoming part of it.
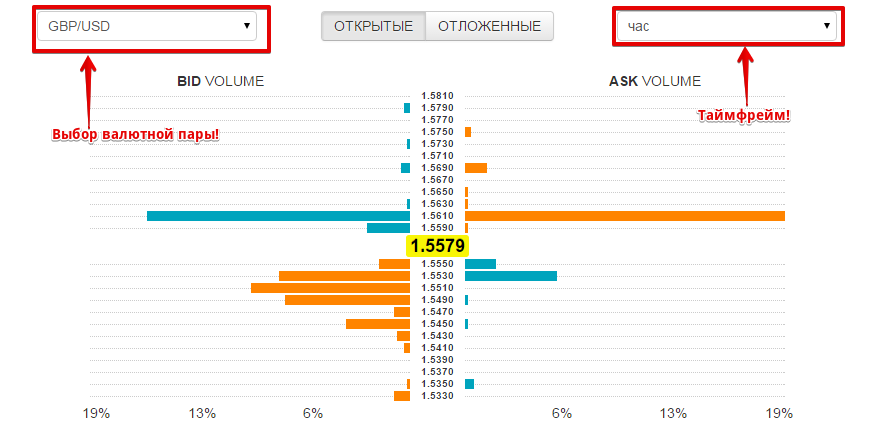
If we look at the GBP/USD currency pair as an example, we can see that a large number of traders are shorting, and at a loss. This suggests that major players will likely continue to push the price higher in order to meet the stop-loss orders of the crowd opposing the trend.
In conclusion, I'd like to say that the Total Position Indicator is a very useful tool, as you can always monitor whether your trade is moving in the right direction. Moreover, by analyzing crowd behavior, you can quickly react to any changes in the market.
You can assess the current situation with open positions at http://www.amarkets.org/

