Genesis Matrix Strategy
Scalping, as a trading style, involves the use of special trading tactics that are aimed at working with market noise.
There are a huge number of strategies online that are called scalping, but only a few are truly effective.
Unfortunately, applying any trading tactic on a five-minute chart is far from scalping, and when we do so, we're simply mistaking wishful thinking for reality.
Therefore, no matter how much you search for real, working tools specifically for scalping, you'll continue to run into the same pitfalls in the form of losses for a very long time.
The Genesis Matrix strategy is one of the most popular trading tactics, familiar to virtually every experienced scalper.
When the strategy first appeared on the market, it generated a huge amount of buzz, with enthusiastic reviews on various platforms.
The developers of Genesis Matrix have addressed this shortcoming, and the result is a powerful tactic for trading on five-minute or fifteen-minute charts of virtually any currency pair with trending markets.
Installing the Genesis Matrix
The Genesis Matrix strategy is based on custom indicators written for trading on the most popular trading platform, Meta Trader 4. Before analyzing the signals, download the file with the indicators and template required for installation at the end of the article. Next, in the open terminal, go to the File menu and open the directory, where you'll find the "indicators" and "template" folders. Copy the downloaded indicators and template to these folders, then close the root directory and restart Meta Trader 4. After restarting, find your template list by right-clicking on the chart, opening the additional menu, and launch Genesis. Genesis Matrix Strategy Indicators : Scalping strategies typically rely heavily on indicators, so don't be surprised when you first launch the strategy, as it includes eight indicators. However, despite this large number, the strategy appears quite well-rounded, and most of the indicators will be familiar even to beginners. So, let's take a brief look at some of them. 1) Heiken Ashi – an indicator that colors candles red or white. In the strategy, it serves as a short-term filter, meaning we will only buy when candles are white and sell when candles are red. 2) FXI Pivots – an indicator that allows you to visually see pivot levels, which in turn often act as support or resistance. It's worth noting that FXI Pivots is used as an auxiliary tool for traders who find it difficult to determine targets and stop orders. 3) ASCTrend1i – a signal arrow indicator that displays the entry point directly on the chart. This indicator completely duplicates the readings of ASCTrend-Matrix 2TF, which is located in the last additional window, so you can safely delete the latter to keep it from cluttering the screen. 4) Stochastic Oscillator – this is the most popular standard oscillator, which provides confirmation in the strategy. So, we'll buy if the Stochastic Oscillator lines have recently exited or are near the oversold zone, and sell if the indicator lines are near the overbought zone. 5) MTF Stochastic v2.0 is a similar indicator to the one we discussed above, except that it displays information from a 15-minute chart instead of a five-minute one, allowing us to compare the trend with a higher time frame. 6) GenesisMatrix 2.22 is the fundamental indicator that gives the strategy its name. In the strategy, it filters the position direction and displays the information in the form of four cubes.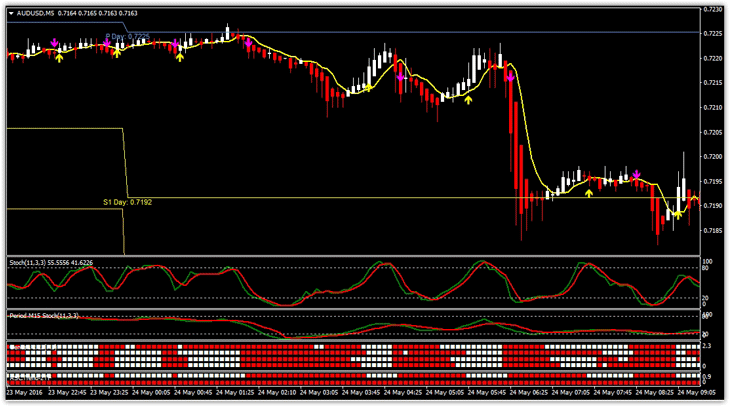
Signals
Buy signal:
1) The ASCTrend1i indicator has displayed an upward arrow.
2) The Heiken Ashi candlestick is white and closed above the moving average.
3) The Stochastic Oscillator is near the oversold zone or has recently exited it and is directed upward.
4) The MTF Stochastic v2.0 is near the oversold zone or has recently exited it and is directed upward.
5) All four GenesisMatrix 2.22 cubes are white.
A stop order is placed at the local minimum, and your profit is placed at the nearest pivot level. You can also exit the market if the GenesisMatrix cubes change color from white to red. See the example below:
Sell signal:
1) The ASCTrend1i indicator has displayed a downward arrow.
2) The Heiken Ashi candlestick is red and closed below the moving average.
3) The Stochastic Oscillator is near the overbought zone or has recently exited it and is pointing downward.
4) The MTF Stochastic v2.0 is near the overbought zone or has recently exited it and is pointing downward.
5) All four GenesisMatrix 2.22 cubes are red.
A stop order is placed at the local maximum, and your profit is placed at the nearest pivot level. You can also exit the market if the GenesisMatrix cubes change color to the opposite of the signal. See the example below: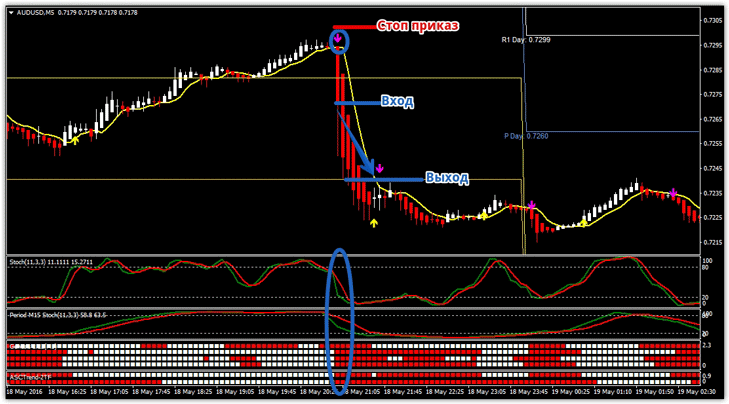
In conclusion, I would like to note that despite this seemingly complex system of rules for entering the market, you will receive a multitude of signals. It is worth noting that this strategy is especially effective during a trend, but it produces many false entries if there is no clearly defined trend in the Forex market.
Download indicators for the strategy.

