Trading strategy "Sniper"
The Sniper trading strategy is considered one of the most popular buying trading strategies in recent years in the Russian-speaking segment.

This tactic was invented by a certain Pavel Dmitriev, who positions himself as an established trader. He claims that this type of exchange trading is effective even when used by a novice trader.
In short, the strategy didn't last long before it began to be actively taught at various brokerage courses, and its tactics became the basis for many trading strategies.
The Sniper trading strategy is an indicator-free trading tactic based on working with basic support and resistance levels, as well as various price levels.
Many who paid for the training course complained that the catchy and catchy names of the various price levels are based on a textbook on technical analysis, so if you're an experienced market participant and have worked with the levels in this strategy many times, you won't find anything complicated.
The strategy is typically applied on a five-minute chart, as well as on an hourly chart to identify the global trend. The choice of currency pairs is entirely up to the trader, as the levels work on any asset.
Signals
The Sniper trading strategy consists of a number of signal blocks that are completely independent of each other and provide certain market entry signalsThe strategy uses the following levels: the previous day's high and low, impulse levels, total impulse levels, bank levels, sharp trend change levels, and consolidation zones.
Typically, all signals boil down to entering the market on a rebound from the above levels, but there are also breakout signals. So, let's take a closer look at the levels and signals.
Minimum and maximum of the day
The previous day's high and low are the strongest support and resistance levels, as they are psychological points. Price reversals typically occur near these levels, as the old rule of buying low and selling high remains.
To trade, highlight these levels as horizontal lines on the daily chart and immediately switch to the five-minute chart. Your goal is to look for positions based on a rebound, not a breakout, of these levels.
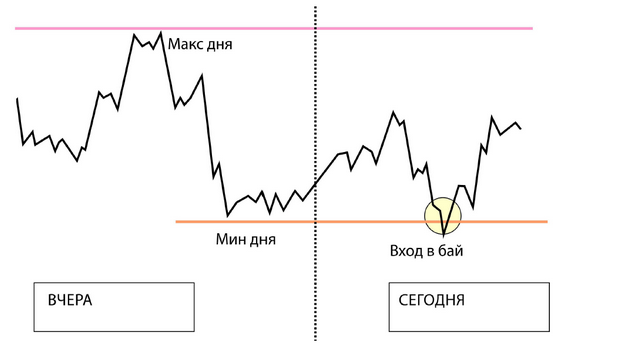
We enter a buy position when the price touches the previous day's low, and a sell position when the price touches the previous day's high. When entering a position, the stop loss should not be higher than 25 points.
Impulse Levels:
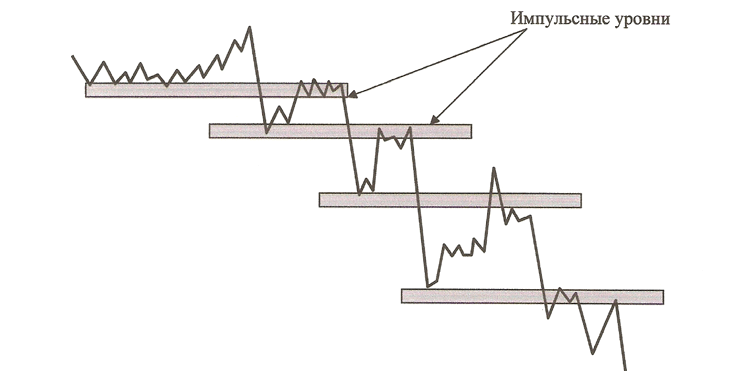
An impulse level differs from a standard support and resistance level in that it involves a retest and subsequent breakout of this level, with the price securing itself with the help of price momentum. By price momentum, the strategy's author means a breakout movement of at least 6 points.
To determine that an impulse level has formed, the following conditions must be met:
1) The price breaks through and bounces off the level.
2) After the bounce, the price breaks through this level with the help of momentum.
3) After the breakout, the price returns to the level.
These levels form a kind of ladder for any trend movement, and an example can be seen below:
Total impulse levels
are historical levels near which reversals or strong breakouts occurred. These levels are found on hourly or four-hour charts, typically near local highs and lows.
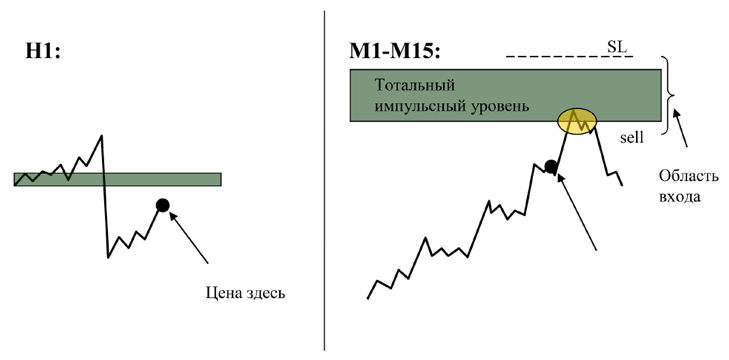
Trading near these levels occurs on a case-by-case basis. Specifically, if you observe a market reaction near it, you open corresponding trades (usually trading on a breakout).
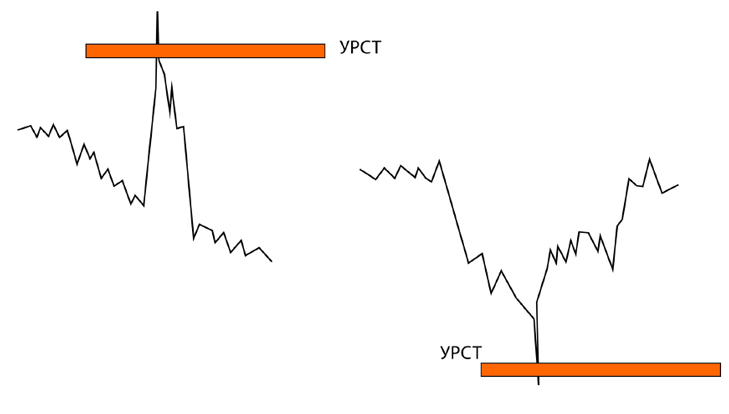
Sharp trend reversal levels
. Sharp trend reversal levels are extremely rare in the market, but a reaction almost always occurs near them. This level forms after the price makes a sharp, sudden jump of 100 or more points and then returns. On the chart, you see this situation as a candlestick with a huge shadow, often called a pin.
The level is drawn along the tip of this pin's shadow, and a market reaction should be expected if the price approaches this zone. After the price has rebounded from this level, it is removed from the chart, as it is considered triggered. Example:
Consolidation Zones.
It's no secret that the market almost always consolidates its strength before making a strong market impulse. For example, a trend is always followed by a compressed sideways movement, followed by a new, prolonged impulse.
A consolidation zone is characterized by a compressed sideways price range, no larger than 18 pips. Market entry occurs in the direction of a breakout of one of the boundaries after a retest of this level. Example:

,
the price moves toward a 15-point profit, after which it often returns to its starting point.
To increase the effectiveness of market entries and reduce the number of reversals, the author recommends moving the stop order to +15 points. This approach involves moving the stop order to breakeven, but not with a zero value, as in the classic version, but with a positive value of +15 points.
In conclusion, I would like to note that all the patterns and levels discussed in the Sniper trading strategy are based on simple principles of technical and graphical analysis, so its effectiveness is beyond doubt.

