ema strategy
The exponential moving average is one of the most effective trend indicators. The EMA is one of the oldest technical analysis indicators, used not only in stock and commodity markets but is still successfully used today in the Forex market and even in binary options trading.

This tool has become the basis for millions of different trading strategies, and its multi-tasking capabilities allow it to be applied in any market conditions.
However, EMA is primarily designed for trend analysis, so strategies based on it are typically trend-following.
The EMA strategy is one of the most common trend-following trading tactics, relying solely on moving averages and no other technical analysis indicators.
Setting up and preparing an ema strategy
The EMA strategy can be used on any trading platform, as this indicator is available on all known exchange platforms. To build the strategy, apply exponential moving averages with parameters of 5, 10, and 90 to the chart, and don't forget to change their color.
If you trade the forex market using the MT4 trading platform, we've prepared a special template for you. You can install it with just a few clicks and run the strategy on any chart. To apply the template, go to the end of the article and download it. Next, install the EMA strategy template script on the trading platform.
To do this, go to the File menu in the open terminal and select "Data Catalog." A list of system folders will appear. Find "Template" and paste the file downloaded at the end of the article into it. After restarting the platform, all that remains is to run the template.
Open the hourly chart of any currency pair and right-click to open the additional menu. Find the template named "EMA Strategy." After launch, the following indicators will automatically appear on your chart:
Purpose of Moving Averages. Signals
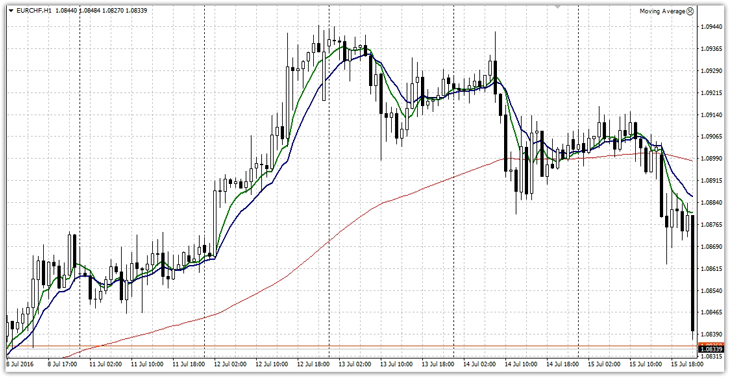
After launching the template, you'll see three moving averages appear, each performing specific functions within the strategy. For example, the 90-period exponential moving average is responsible for determining the current trend and, consequently, the direction of opening positions. When analyzing a trend, the slope of the moving average and the price's position relative to it are taken into account.
If the 90-period EMA slopes downwards and the price is below it, the market is experiencing a strong downtrend. If the 90-period EMA slopes upwards and the price is above it, the market is experiencing a strong uptrend.
Moving averages with periods of 5 and 10 serve as signals when they intersect, but positions are opened strictly in the direction of the global trend. So, let's move on to the signals.
Buy signal:
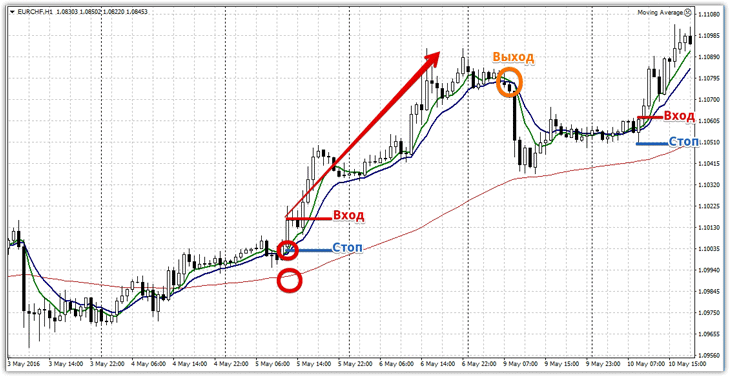
1) An uptrend has formed in the market, the price is above the 90-period EMA, and the slope of the line is upward.
2) The fast 5-period EMA (green line) crosses the slow 10-period EMA (blue line) from below.
A position should be opened only on a new candlestick, not at the moment of the crossover itself. Risks should be limited at the low of the signal candlestick (at the tip of the shadow), and the position should be exited when the green line crosses the blue line from above. Example trade:
Sell signal:
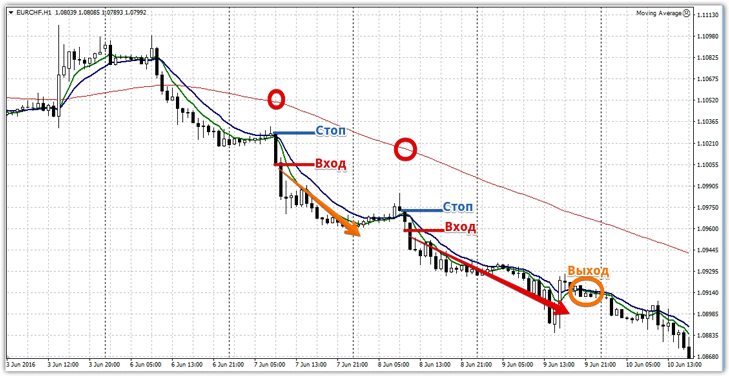
1) The market is in a downtrend, with the price below the 90-period EMA, and the slope is downward.
2) The fast 5-period EMA (green line) crosses the slow 10-period EMA (blue line) downward.
Enter the position only at the close of the candle, remembering to set a stop loss at the high of the signal candle. Exit the market and close the position only if we are stopped out by the stop loss or if the moving averages cross back. Example of a sell trade:
In conclusion, I'd like to point out that the EMA strategy discussed is primarily designed for trend-following trading. The stronger and more confident the trend, the clearer the signals with lower risk you'll receive. However, because moving averages lag slightly, you may receive a significant number of false signals during a sideways market or so-called market swing.
Therefore, we recommend avoiding trading during the Asian session and opting for the European session. If you don't have the time to track the reverse crossover of moving averages to close a trade, you can use a static profit target. However, it should be at least three stop orders, otherwise, stop orders received during a sideways market won't be offset by long profits following the trend.
EMA Strategy Template

