
Strategy of V. Barishpolts - “Surfing”
Viktor Barishpolets is one of the most scandalous post-Soviet traders who, at the peak of his popularity in 2007, closed his open hedge fund and ran away with a huge pile of money.
Victor gained trust thanks to his own openness, namely, almost all investors knew which accounts were being traded and, most importantly, what strategy was being used.
Victor sent out a weekly newsletter in which he shared trading tactics and trained his own investors.
The most interesting thing is that the person actually traded on Forex and anyone could get acquainted with the statistics of his trading in real-time mode.
In his last letter, Victor mentioned that the Forex fund was beginning to go beyond the law, since there was no such accounting for paying taxes, and the rapid influx of people wishing to invest in it only brought its demise closer.
It is worth noting that Borishpolyets’ team gave away investor money for a very long time, which whitened the reputation of this trader in the eyes of investors who came to understand the situation.
The “Surfing” strategy of V. Barishpolts is an excellent strategy that combines two simple indicators, namely the Williams Fractal and the regular moving average.
The tactic is multi-currency, so the choice of currency pair depends on the high cost of its use, namely, the smaller the spread, the more effective the strategy is.
The author of the strategy recommends using it either on hourly charts if you are trading intraday, or on daily charts if you are a positional trader. For trading on small time frames and scalping the strategy is not suitable.
Setting up a trading strategy Surfing
The Surfing trading strategy can be used in absolutely any trading terminal. In order to form it, plot two moving averages with a period of 89 and 144 on the chart and assign them different colors. Also apply the Bill Williams Fractal indicator to the chart, then save the template.If you use the MT4 trading platform, we have created a template especially for you, after installation and launch of which everything indicators will appear automatically on the chart.
To do this, after downloading the file at the end of the article, you will need to place it in the Template folder inside your data directory. To enter the data directory, launch the trading terminal and in the top left menu, open the menu called “File”.
You will see a list of options, among which select “Open data directory”. After you complete the installation procedure, call up the additional menu on the hourly or daily chart and launch the template called “Surfing”.
Signals of the “Surfing” strategy
First of all, in the Surfing strategy, it is necessary to determine the dominant trend in the market, in the direction of which positions are opened and signals are considered.
To do this, we will be helped by two moving averages with a period of 89 and 144. So, if the angle of inclination of the moving averages is directed upward, and the price is above them, the market uptrend. If the slope of the moving averages is downward, and the price is below them, the market is in a downward trend.
It is also worth noting that Victor considered the Bill Williams Fractal to be a lagging signal, so he suggested opening a position before it appeared on the fourth candle, instead of the fifth as Williams does.
However, as practice shows, it is difficult for beginners to do without this indicator, so it was left in the strategy for ease of perception.
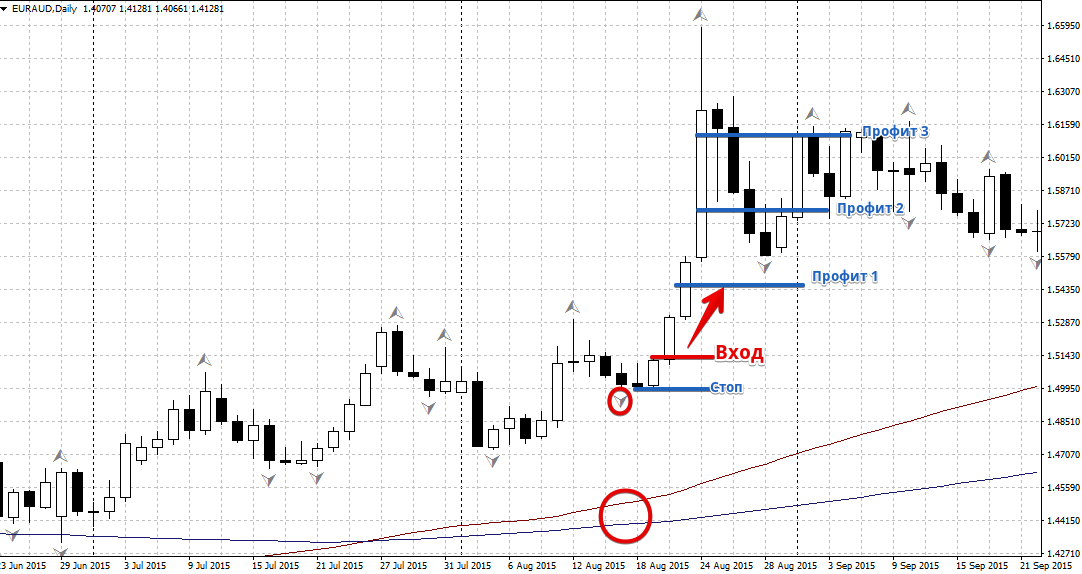
Buy signal:
1) The price is above the moving averages with a period of 89 and 144, and their slope angle is directed upward.
2) A downward fractal has formed on the market (the fractal arrow is directed downward).
After you open a position, you should set a stop order at the low of the previous candle. A profit is not set, but instead the stop is moved to a no-loss position and follows the price every 15 points. Example:
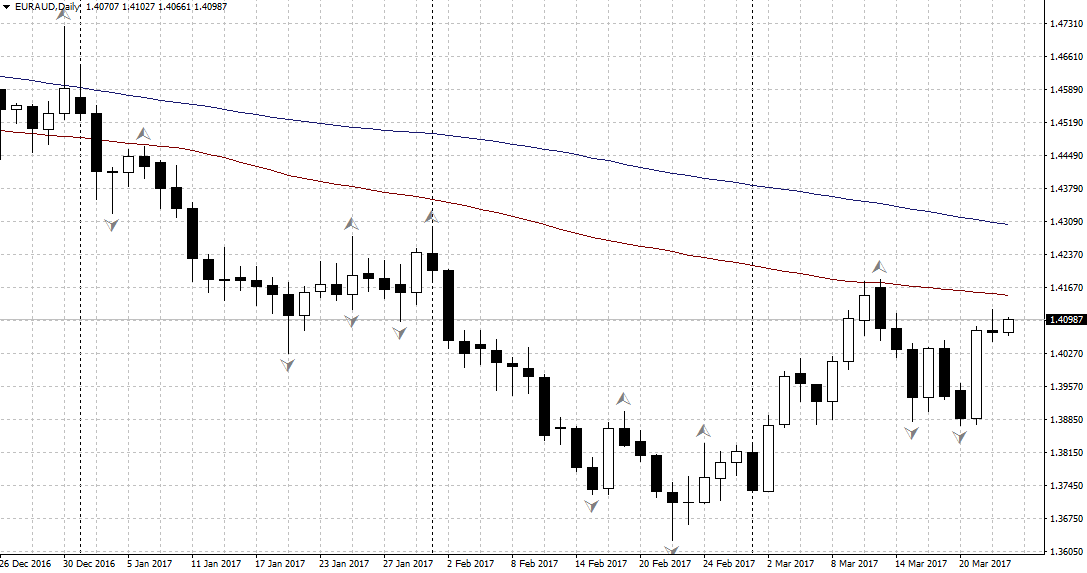
Sell signal:
1) The price is under the moving averages with a period of 89 and 144, and their slope angle is directed downward.
2) An ascending fractal has formed on the market (the fractal arrow is directed upward).
After you open a position, you should set a stop order at the high level of the previous candle. Instead of static profit, you should use trailing stop in increments of 15-30 points depending on what time frame you are working on. Example:

When applying the strategy, V. Barishpolets recommended drawing the nearest support and resistance levels, channels, since it was at their boundaries that the strategy gave the least number of false signals.
In conclusion, it is worth noting that, despite the tarnished reputation of V. Barishpolets, his strategy has a completely logical rationale for opening positions. The strategy has been coded many times into various paid advisors and left only positive feedback among traders.
Download the template.