Another Simple System Strategy
When trading any trading strategy, it is crucial to correctly identify the current market trend and then consider signals to open in its direction.
Many traders underestimate the importance of identifying the global trend, although in fact, even those impulse strategies, in one way or another, are guided by global price movement.
Let's not even get into details, even if we look at it from a mathematical point of view, namely, taking the theory of probability, the chance of making a profit by following the price is an order of magnitude higher than if you take a position against it.
This is why trend strategies remain a viable tool in the Forex market, despite the fact that markets change and some indicators may become obsolete.
At its core, the strategy is universal and multi-currency, but its author is inclined to believe that it is most effective on a fifteen-minute chart of the Euro/Dollar and Pound/Dollar currency pairs.
The strategy is linked to European and American trading session, namely at the moment when the market is most volatile.
Setting up Another Simple System strategy
To install the strategy, you'll need to download all the necessary strategy files along with the template at the end of the article. Afterward, you'll need to install the indicators and template directly into the MT4 trading platform.The installation procedure for Another Simple System is no different from installing any other trading strategy, namely, you will need to reset the indicators and templates to the appropriate folders in the terminal data directory.
To launch the data catalog, open your trading platform and go to the File menu in the upper left corner. A list of options should appear, including "Open Data Catalog" and launch it.
After launching the catalog, the MT4 system folders will appear on your screen. Among them, find a folder called Indicators and drop the indicators into it, and also find a folder called Template and drop the template into it.
In order for the platform to see the changes resulting from the file installation, it must be updated in the navigator panel or simply restarted.
After restarting the terminal, call up the additional menu on the chart and run a template called Another Simple System on the fifteen-minute chart.
Strategy indicators
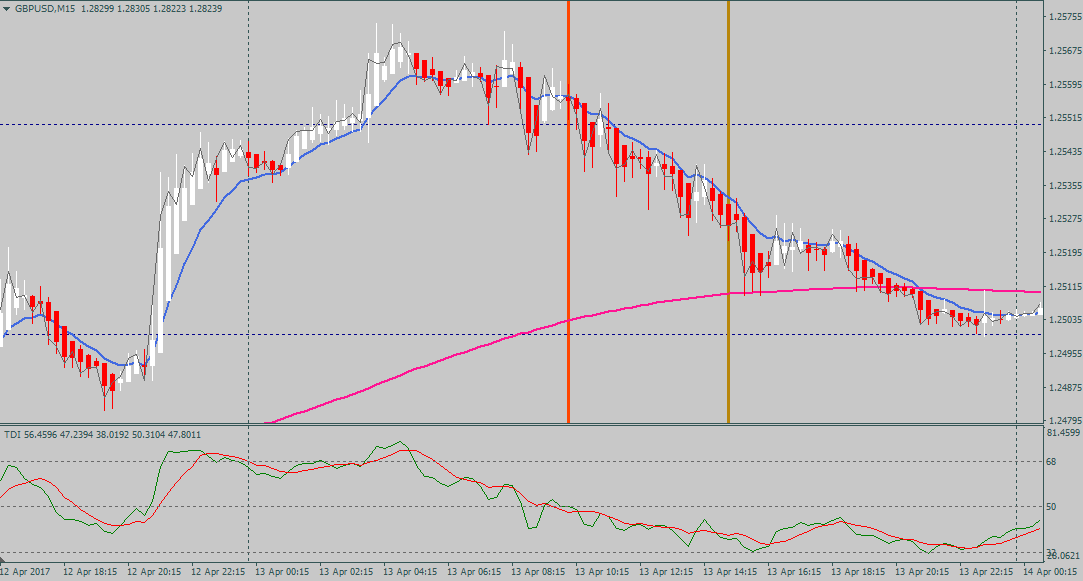
The strategy is based on seven different indicators, but in reality, only three influence the strategy's signals, which you'll learn about in this section of the article. So, let's briefly review the main indicators:
1) The TDI is an oscillator located at the very bottom of the chart, represented by two green and red lines. The TDI is a symbiosis of two standard indicators, namely the relative strength index and the moving average. It serves as a signaling function in the strategy.
2) Moving Average – This is a standard trend indicator that serves two main functions in the strategy: signaling and trend-determining. The strategy directly utilizes three moving averages with periods of 200, 800, and 10.
3) Heiken Ashi is a technical indicator that colors candles red and white. In this strategy, it serves as a short-term trend filter.
All other indicators are auxiliary, namely, they mark round levels on the chart, and also show the opening of the European and American trading sessions with vertical lines.
Another Simple System Strategy Signals
The most important rule when using the Another Simple System strategy is to enter the market only after the signal candle closes. So, let's look at the rules strategies.
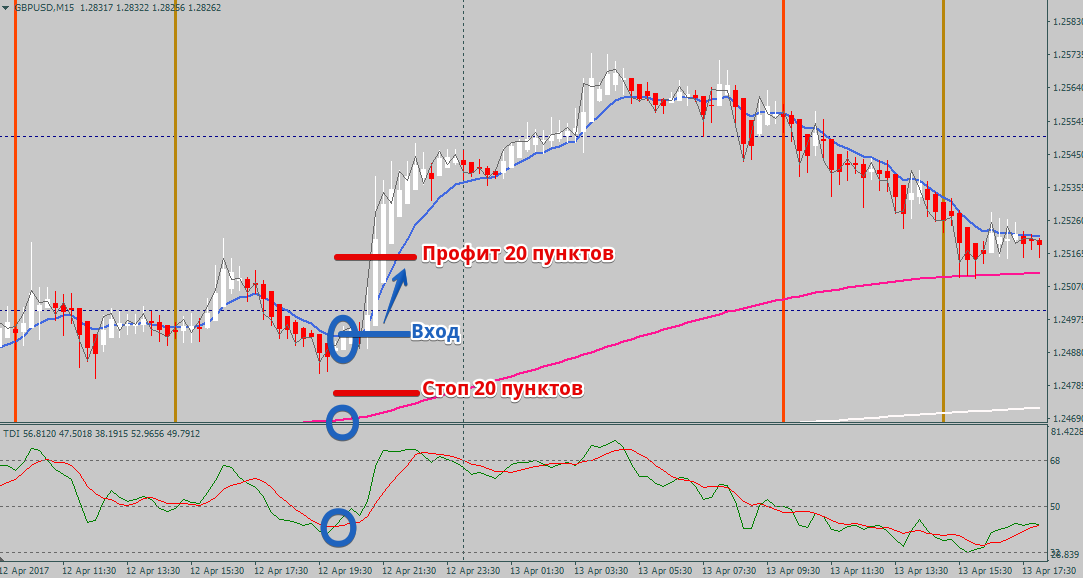
Buy signal:
1) There is an upward trend in the market, which is confirmed by the price being above the moving average with a period of 200 and 800.
2) TDI should not be in the overbought zone, namely above the 68 mark.
3) The green TDI line is crossing or has recently crossed the red TDI line from bottom to top.
4) The price crosses the 10-period moving average from bottom to top.
5) Heiken Ashi white.
When using the strategy, the author recommends using a static stop loss and profit, which are equal to 20
points Example:
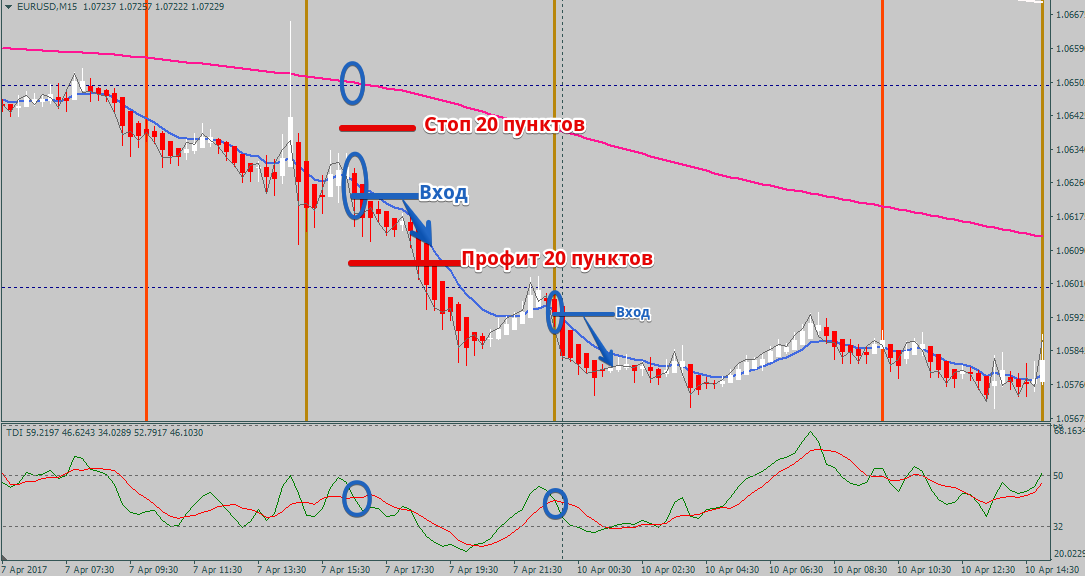
Sell signal:
1) There is a downward trend in the market, which is confirmed by the price being below the moving average with a period of 200 and 800.
2) TDI should not be in the oversold zone, namely below the 32 mark.
3) The green TDI line crosses or has recently crossed the red TDI line from top to bottom.
4) The price crosses the 10-period moving average from top to bottom.
5) Heiken Ashi is red.
Stop loss and the profit, as with a buy position, is 20 points. Example:
In conclusion, it's worth noting that despite the large number of indicators, any beginner can handle these strategies. Moreover, since you'll be using a fifteen-minute chart, you'll have plenty of trading signals.
Download Another Simple System tools

