DiNapoli Strategy.
The vast majority of traders are very biased towards trading methods from the distant past, as they are convinced that the markets have changed dramatically, and the tactics that were relevant 10-20 years ago are incapable of generating profit in today's realities.
Of course, there's some truth to this statement, but if you look at most modern Forex trading strategies, you'll see that they're based on the same old indicators, slightly modified.
Therefore, it's rather foolish to write off strategies that are more than a decade old, especially if they've generated huge profits.
One such strategy, which we'll examine in this article, was created by John DiNapoli, a renowned trader with over thirty years of trading experience.
It's worth noting that John DiNapoli described numerous approaches and market entry signals in his book, and this DiNapoli strategy is just one of them.
The strategy itself is universal and can be used on any currency pair or CFD, and the strategy itself is designed for intraday and medium-term trading.
Setting up the DiNapoli Strategy
To use the strategy on any trading platform, apply a 25-period, 5-offset moving average to the chart, as well as a 3-period, 3-offset moving average.
In addition to these two indicators, add the MACD and Stochastic indicators to the chart. To implement the strategy, your platform must also have the Fibonacci Grid tool.
For MT4 trading platform users, we've prepared a special template. Download and install it, and you'll be able to use the strategy in minutes.
To install the template, download it and then place it in the appropriate folder in your terminal's data directory. To access the data directory, launch MT4 and click the File menu in the upper left corner.
You'll see a list of options, including "Open Data Folder."
After opening the directory, a list of system folders will appear on your screen. Find the "Template" folder and copy the downloaded DiNapoli strategy template file into it.
It's crucial to restart the trading platform or update it in the navigator panel after installation, otherwise the terminal won't recognize the new files.
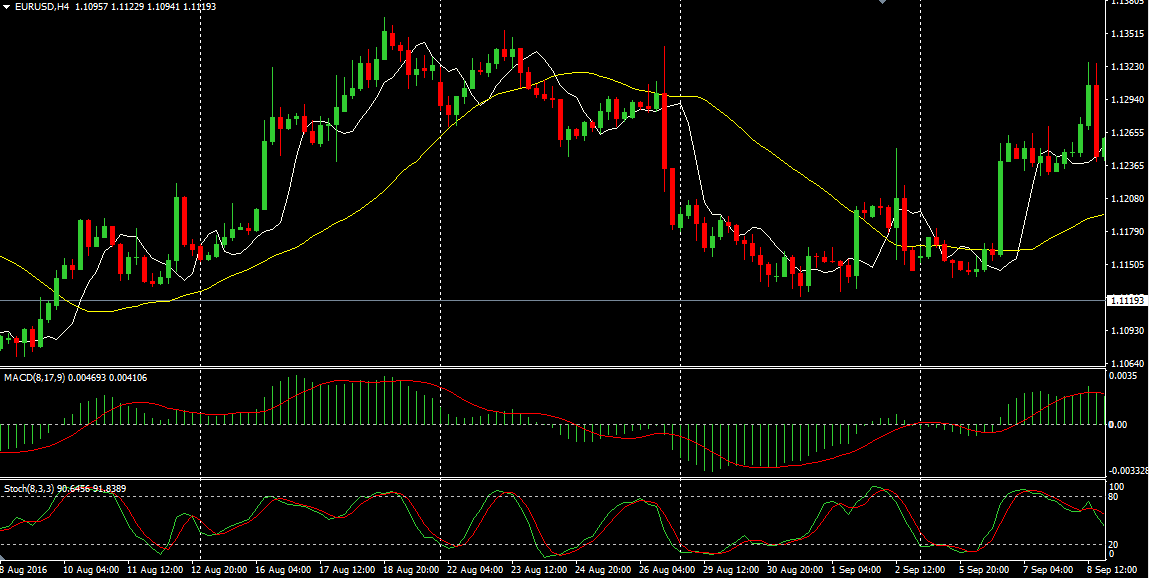
After restarting the platform, open an hourly or four-hour chart for the currency pair you've selected and run the DiNapoli template on it.
DiNapoli Strategy Signals
If you read John DiNapoli's book, you'll see that indicators in almost all of his approaches are used solely to determine trends, not as signaling tools.
same is true for the DiNapoli strategy.
The main signaling tool in the strategy is the Fibonacci grid, or more precisely, level 38.2.
For a downward wave, the grid is constructed from the upper point (high) to the lower point (low).
For an upward wave, it is constructed from the lower point (low) to the highest point. Level 38.2 acts as a signaling tool; a position is opened upon its breakout, while the other indicators merely serve as a filter.
So, let's move on to the signals themselves.
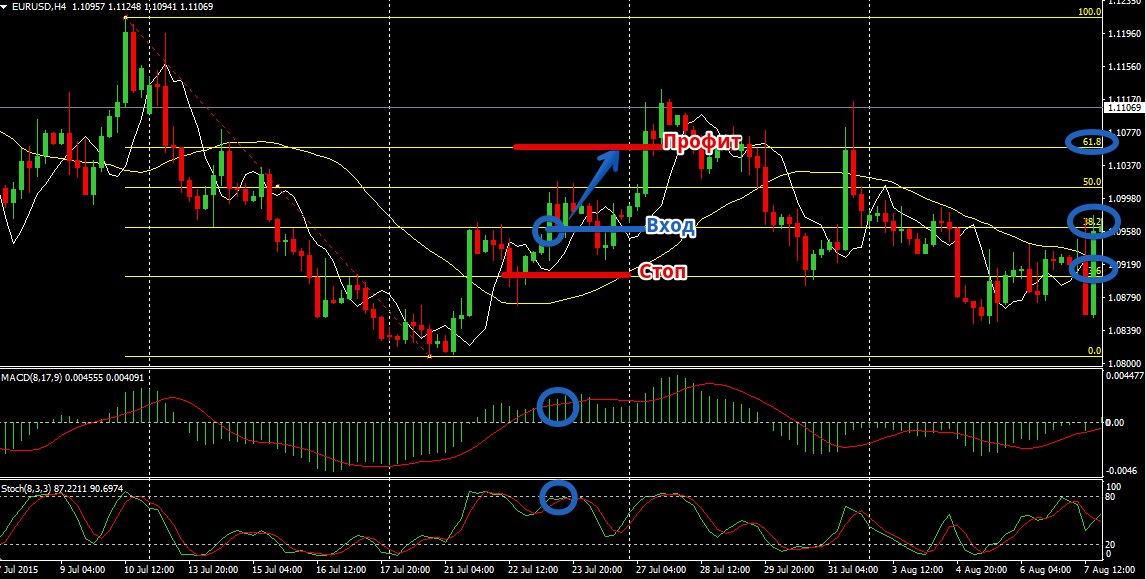
Buy signal:
1) The price breaks through the 38.2 Fibonacci grid level from the bottom up.
2) At the moment of the breakout, the 3-period moving average should be above the 25-period moving average.
3) The MACD histogram hits or is above level 0.
4) The Stochastic indicator lines are directed upward and may be in the overbought zone.
The strategy's author believed that only weak players exit the market in the overbought zone of the stochastic oscillator, while strong players continue to push the price upward. A stop order should be set at the local minimum or at level 23.6 of the Fibonacci grid.
The position is exited at a profit, which should be no less than the stop order in points. Level 61.8 can be used as a reference point. Example:
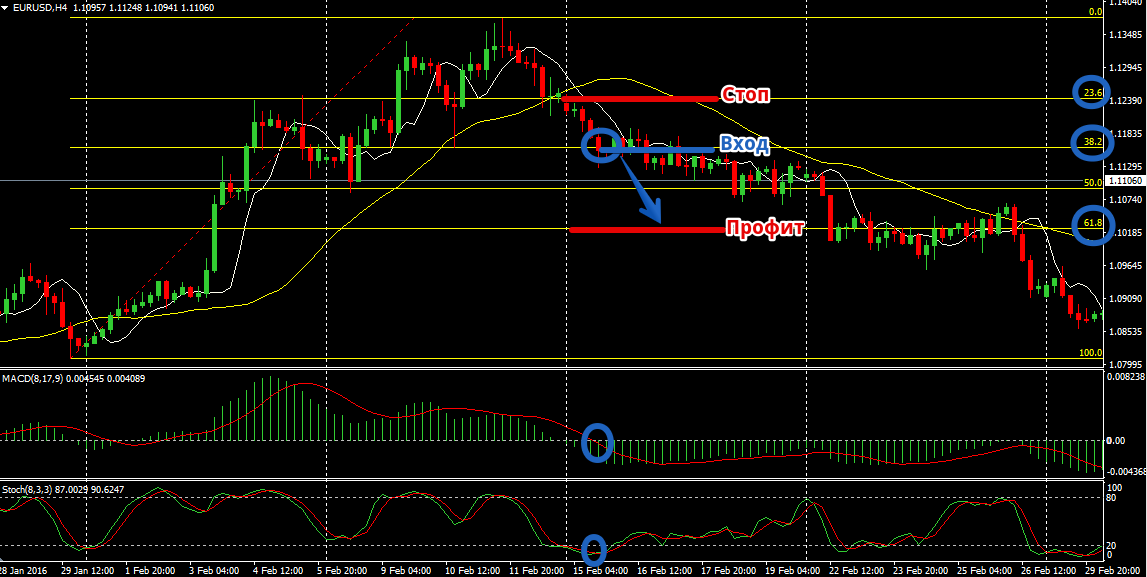
Sell signal:
1) The price breaks through the 38.2 Fibonacci grid level from top to bottom.
2) At the moment of the breakout, the 3-period moving average should be below the 25-period moving average.
3) The MACD histogram either breaks through the 0 level from top to bottom or is below it.
4) The Stochastic indicator lines are pointing downwards and may be in the oversold zone.
Placing stop orders and profit targets based on Fibonacci levels is similar to what we discussed when opening a buy position. Example:
In conclusion, it's worth noting that the DiNapoli strategy is primarily designed for more experienced market participants who are comfortable working not only with indicators but also with Fibonacci.
Another advantage of the strategy is that by placing stops and profits on a grid, your risk will be one and a half times less than the potential profit.
Download the ready-made DiNapoli strategy template.

