Forex bar.
A bar chart is one way to display price movements and is used in 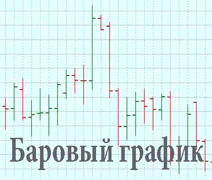 technical analysis. The chart is created using Forex bars that represent a specific time frame.
A Forex bar is a specific time period, expressed as a graphical representation, allowing you to see key price indicators on a selected time frame.
The main bar time frames are 1, 5, 15, and 30 minutes, 1 and 4 hours, daily, weekly, and monthly. By selecting the appropriate time frame, you can view between 20 and 100 bars, depending on the display scale.
<Each of which will correspond in length to the name of the chart timeframe, for example, on M15, one bar is equal to 15 minutes.
Forex bar structure.
Each bar has a complex structure that allows us to assess price behavior:
Opening price is the price of the first trade in a given period.
Closing price is the last trade in the time frame.
High is the highest price reached.
Low is the lowest price during a given period.
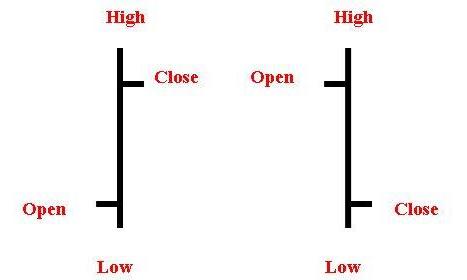
You can also see the direction of the price movement on the analyzed bar, primarily by the opening and closing price markers. If the opening marker is at the bottom of the bar on the left side, and the closing marker is at the top and on the right side, it's an ascending time frame, and vice versa.
However, it's easier to slightly adjust the settings in the trader's trading terminal : right-click on the chart and select "Properties." In the window that opens, go to the "Colors" tab and change the downward var to Red. Now all ascending Forex bars in our chart window are displayed in green, and those indicating a descending trend are displayed in red.

