ZULUTRADE – the first steps to selecting real managers
Greetings, dear visitors. In my previous article, " SETTING UP ZULUTRADE, " I discussed the platform's basic signal copying capabilities, the various traders' filter options, and how to approach analyzing their trading strategies.
Today, I'd like to work with you to select several managers, look at their statistics, and share my initial results and, not surprisingly, my initial mistakes.
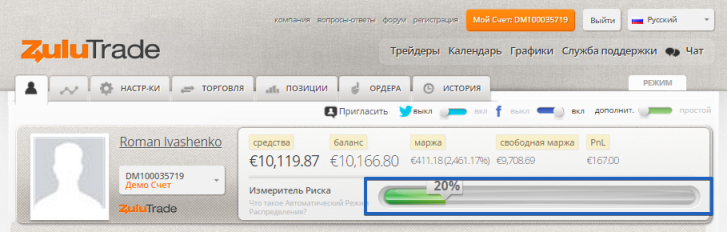
So, to begin with, I decided to open a demo account with the company for $10,000 to select the first traders and see how they trade in practice, rather than based on the platform's promises.
For me, a 20 percent risk is acceptable, so I set that value. It's worth noting that once you set the risk, the system will open trades automatically increasing or decreasing the lot size relative to the managing traders whose signals you're copying. You can see the risk slider in the image below:
My second step was selecting my first managers. To be honest, I didn't break down the risk for each manager by percentage. My goal was to find 5-7 candidates and simply evaluate their performance, identify weak links in the chain, and model acceptable results. When selecting managers, I tried to base my selection on their drawdowns and returns, and I also made sure the trader had been issuing signals for at least three months.
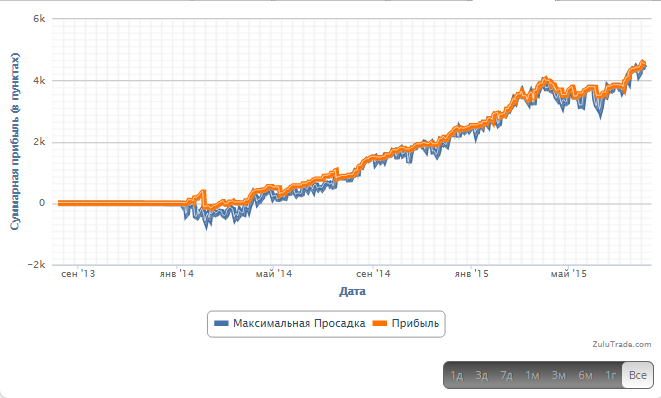
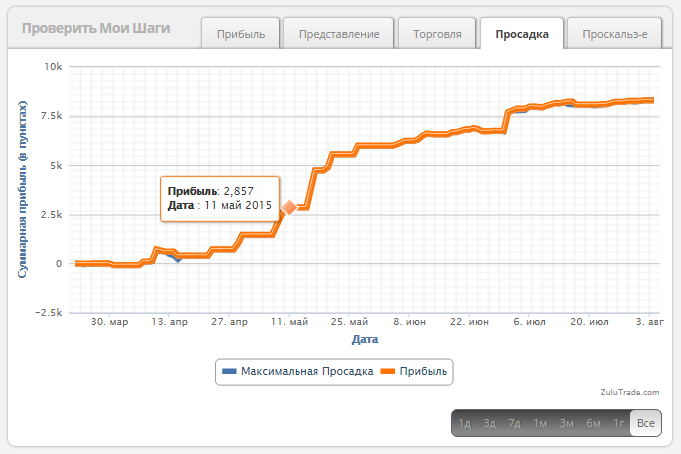
Of course, many people chase experienced traders, choosing managers with accounts at least six months old, but in my opinion, someone who's been sticking to their strategy for three months is also not a greenhorn. That's why the first trader I chose for my portfolio was Pminvestcap. He's been successfully sending signals for 81 weeks now, and his drawdown percentage hasn't exceeded 14 percent, despite a fairly high return. You can see his growth and drawdown chart below:
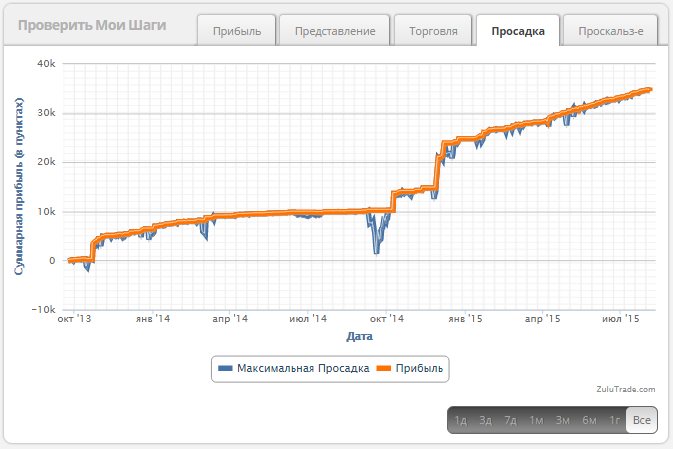
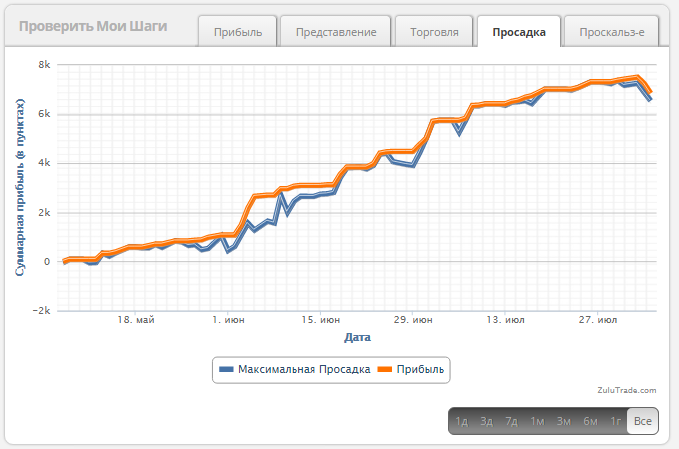
The second candidate for my portfolio was trader uuicc1. He's been successfully sending signals in the market for 96 weeks, with a drawdown of 18 percent (the highest recorded) and a profit of approximately 120 percent per year. While the drawdown is certainly a bit steep, the growth over such a long period is also impressive. You can see the balance growth and drawdown graph below:
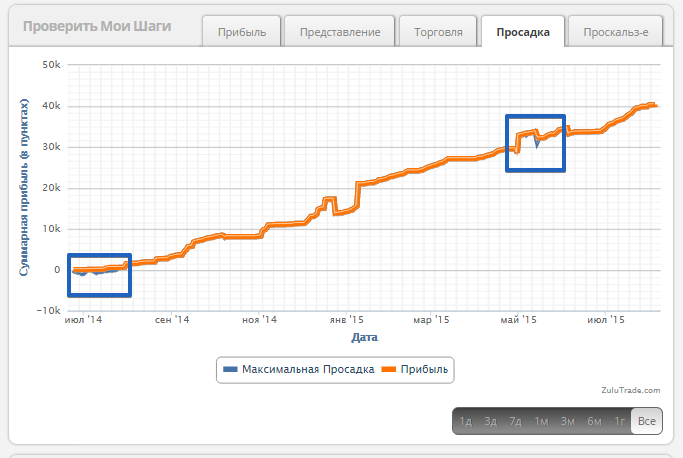
The third candidate for the portfolio was trader TraderVic. If I'm not mistaken, he's ranked first among the top managers. He's been in the market for 57 weeks, with a profit of 1000% per annum, and a maximum drawdown of a whopping three percent.
By all the rules of investing and trading, this is the goose that lays the golden eggs. The drawdown chart is practically impossible to discern behind the balance chart, indicating strict adherence to all the rules of the trading strategy. The growth and drawdown chart is shown in the image below:
The fourth candidate is a relative newcomer, who has only been in the market for 18 weeks. The trader goes by the handle MWTechTransilvania. During this time, he has managed to gain over 8,000 pips in 76 trades. The average position duration is 6 days, and the minimum profit per trade is 100 pips.
Simply put, this is a medium-term trader with a good strategy, as the drawdown percentage did not exceed 2 percent of the deposit. The growth chart shows that the trader is not averaging or scalping, but is clearly taking profits on large movements. You can see the growth and drawdown chart in the image below:
And finally, the fifth candidate, ferifgip. He's still relatively new to the market, having only been trading with the system for 12 weeks. However, in such a short period of time, he managed to gain 6,500 pips with a 21% drawdown. While the drawdown is certainly high, I was particularly impressed by the winning percentage, which was 88%. You can see the balance growth and drawdown graph below:
After selecting all the managers I needed, I decided to run a portfolio simulation for one year. This feature is available in your Zulu account under the list of traders. You can see the calculation results for the risks I specified in the image below:
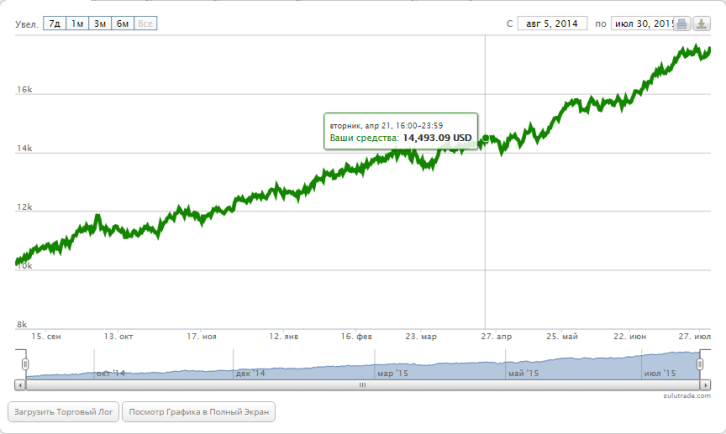
Based on my calculations, if all traders adhere to their trading tactics, I could make a profit of 73.4% of my deposit by copying their signals. I consider this a good investment over one year. Now, I'll share the traders' trading results from July 27, 2015, to August 4, 2015:
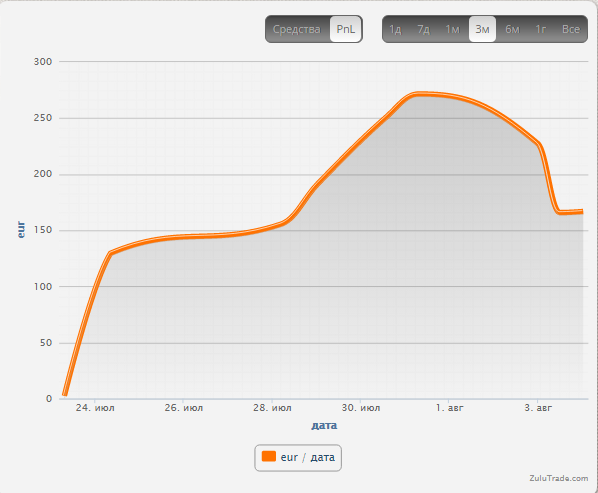
I'll be monitoring the account's performance going forward and sharing my observations and impressions. However, as you can see from the performance chart, things aren't as smooth and rosy as they appear in the managers' accounts. Despite this, the portfolio managed to generate a 1.6% return in a short period of time. In future articles, we'll try to identify the portfolio's flaws and perhaps replace some of the portfolio's managers or, conversely, practice risk management.

