US Manufacturing Purchasing Managers' Index (PMI) and EUR/USD
One of the most popular tools of fundamental analysis that  every fundamentalist uses are indices.
Open any economic calendar and you'll see that these are singled out as highly volatile news items. Regardless of the service you use to conduct fundamental market analysis, indices receive special attention, describing their importance and impact on the national currency exchange rate.
In terms of their influence on the thinking of traders and investors, indices can be placed second after macroeconomic indicators such as GDP, interest rates, and the trade balance.
But is this really true? Does a news release about a particular index really have such a strong impact on market participants?
Unfortunately, information about the impact of certain news items on the Forex market is often exaggerated, so it's worth thinking three times before deciding to open a position. One such popular index recommended for trading dollar-based currency pairs is
The US Manufacturing Purchasing Managers' Index (PMI) is calculated and published by the Institute for Supply Management and is based on a survey of senior executives at 400 different manufacturing companies across the US.
This survey allows you to see business activity in the manufacturing industry, which is the heart of any country's economy, and in our case, the heart of the US economy. The data is published monthly, so you can track the dynamics of the industry as a whole.
The use of the index in forex trading boils down to the fact that the trader compares the data for the current period with the previous month. If the index value has increased compared to the previous month, this is a signal of strengthening of the USD, and if there has been a decrease, this is a signal of deterioration of business activity and weakness of the USD.
However, analysts say a reading above 50 points indicates a significant expansion of business activity in the manufacturing sector, while a reading below 50 indicates a strong economic downturn, which could be a harbinger of a crisis or a turning point when the economy emerges from the bottom.
Given the high importance of this indicator for traders, I suggest examining historical market behavior after the news is published, assessing the actual impact of this indicator on traders, and testing the profitability of trading on the EUR/USD currency pair given the popularity of this instrument.
On July 1, 2015, the released data on business activity in the manufacturing sector indicated an expansion in business activity, as the reading was 52.8 last month, but this month it increased to 53.5. Positive data should lead to a stronger dollar, so we should see a decline in the EUR/USD currency pair. The real picture of what happened is shown in the image below:
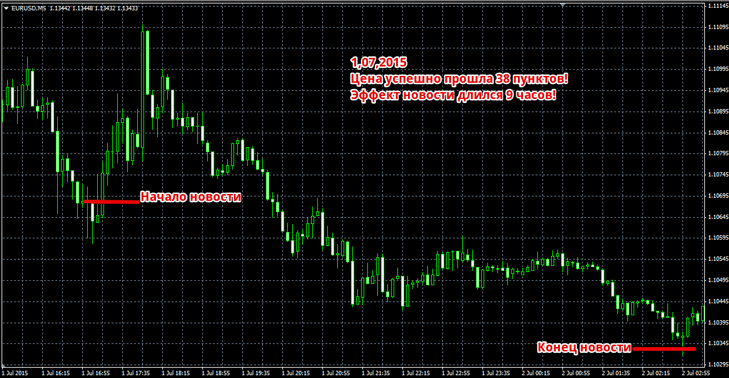
The chart shows that market participants didn't immediately absorb the positive data, so for the first 45 minutes, we can see the price moving against the news, with fairly large candlesticks, which caused more than one market participant to be triggered by stop orders. However, an hour later, a real reaction to the information's release began, and the price gradually moved 38 points over the course of nine hours. The news ended with a final slowdown and a sideways market entry.
On August 3, 2015, the business activity index in the manufacturing sector was 52.7, which primarily tells us about the deterioration of things in the manufacturing sector, since last month the index was 53.5.
The reaction to this indicator should be strong, as in addition to the noticeable deterioration compared to last month, the data was even worse for the period before that. Therefore, given these indicators, it's safe to assume that the EUR/USD currency pair will head higher. We can see how the price behaved below:
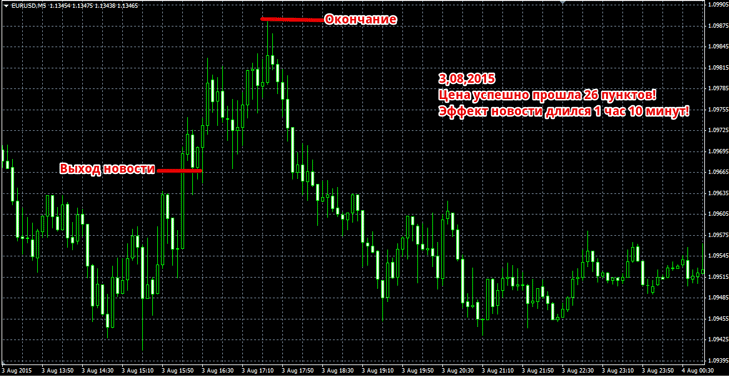
The image shows that the expected strong reaction simply didn't materialize, but the price successfully gained 26 pips, with the growth lasting for 1 hour and 10 minutes. After the news wore off, we saw a sharp decline in the currency pair's chart, which even exceeded the entry point and probable stop orders.
On September 1, 2015, data released indicated another deterioration in the manufacturing sector, as the actual reading of 51.1 was significantly lower than the previous month's reading of 52.7. Therefore, it was entirely reasonable to expect a rise in the EUR/USD pair due to the dollar's weakness. Traders' reactions can be seen below:
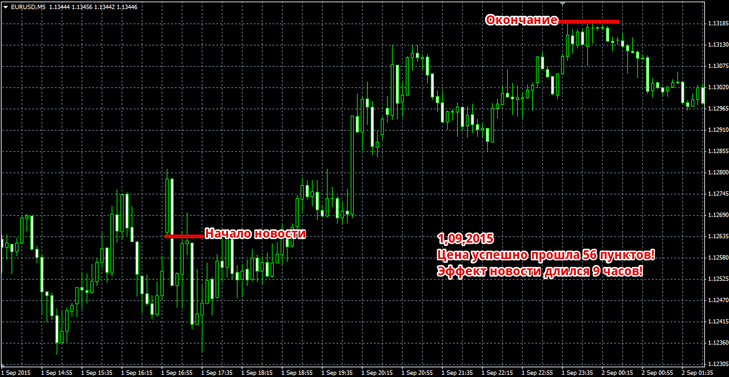
Under pressure from further negative dollar news, the chart rapidly moved higher and continued to rise for nine hours, moving 56 points in the right direction.
On October 1, 2015, further negative dollar data was released, as business activity contracted from 51.1 to 50.2. It was expected that the market would react with a rise in the EUR/USD currency pair. The actual reaction can be seen below:
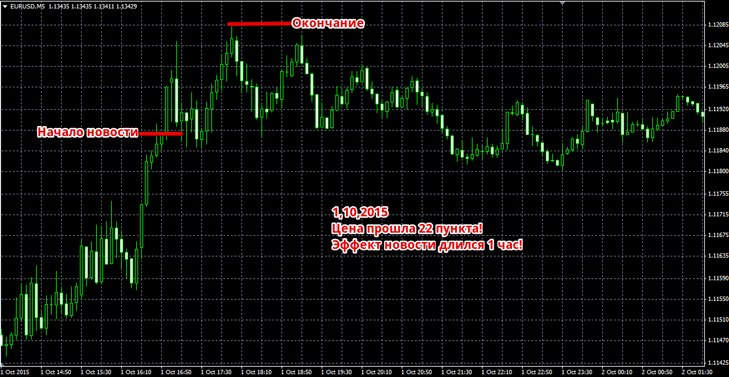
The reaction to the news can safely be called sluggish, because the price moved only 22 points within an hour, after which it entered a prolonged sideways movement and returned to the initial entry point.
Having studied the historical price behavior following the news release, we encounter yet another situation where analysts simply overestimate the actual impact of a given index on market participants. Of course, in all four examples, the news played out, and the chart did indeed move in the direction of the indicator. However, it's important to remember that there was not a single trend reversal or strong movement, as is often attributed to this news.
If we calculate the probable profit from trading on this news, we arrive at the following figures: 22 + 22 + 22 - 22 = 44 points. The take-profit and stop-loss orders were taken at the minimum price movement, and one negative trade resulted from the price moving against the news by approximately 30 points in one scenario.

