US Retail Sales Index and USD/JPY
The impact of increased retail sales on the stability and prosperity of any country's economy  is obvious. Without any economic education, one can easily construct a logical chain that directly traces the relationship between increased retail sales and economic development.
When you look at retail sales data, you should immediately realize that you are indirectly analyzing consumer spending, production, and, oddly enough, employment.
All three of the above criteria, in one way or another, are included in the basic retail sales index, since with the growth of retail sales we can observe an increase in jobs, the expansion of production and small businesses, and also track how much richer the country's citizens have become.
After all, you must agree that a poor country with low wages simply cannot have a large volume of retail sales, since people simply do not have the means to make purchases.
The core retail sales index in the United States is released on a monthly basis and includes collected data on the volume of goods sold by retail chains, which are selected based on type and size, so this figure includes sales of both large retail chains and small stores.
This indicator allows you to easily track the dynamics of the US economy. However, it's important to note that this index does not include data on retail automobile sales, as their prices are highly volatile, which could distort the data.
The core US retail sales index is believed to have a strong impact on the dollar exchange rate, so traders regularly monitor the release of monthly reports. Trading this news is very simple. You can find out when the next release is released in the economic calendar.
If you observe, a decline in retail sales is a sign of a deteriorating US economy, leading to a decline in the USD. An increase in sales indicates an improving economic situation, leading to a rise in the USD. This situation is observed in almost any dollar-based currency pair, but traders prefer to trade USD/JPY because Japan is the largest exporter of goods to the US.
However, this simple interpretation of the news conceals the complexity of its application in trading, as no one can predict how long the price will move after the data's release or how long the market will rage. Therefore, I propose examining the four most recent publications and calculating the market reaction for the USD/JPY currency pair.
On July 14, 2015, the core retail trade index declined sharply compared to the previous month. Analysts had predicted a 0.5 percent decline compared to the previous month, but no one could have predicted the actual decline of -0.1 percent.
A sharp decline in retail sales indicates a deterioration in the US economy, so the USD/JPY pair should rapidly decline. The actual reaction to this deterioration is shown in the image below:
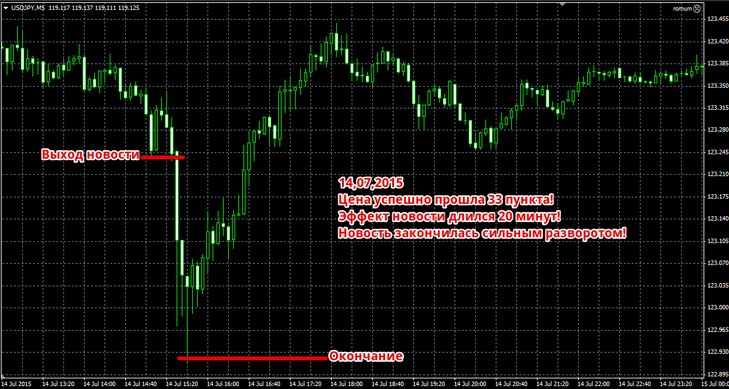
Despite the strong negative data, the price only managed to move 33 points, after which a strong reversal followed, returning the market to its starting point. The market reacted extremely emotionally to the news, so we were only able to observe its effect for 20 minutes, with the first 10 minutes accounting for all the major movement.
On August 13, 2015, almost all traders faced a difficult situation. The data released was completely identical to analysts' forecasts and was identical to the previous month's publication, which was 0.4 percent.
In such a situation, the price most often moves in the direction of the main trend. Therefore, since the trend at that time was bullish, it's safe to assume that the USD/JPY currency pair will go up. The actual price reaction to the news release is shown in the image below:

As in the previous example, we're faced with a situation where the market reacts quickly to the news, but the turbulence lasts only a short time—in our case, just 15 minutes. During this time, the price successfully moved 17 pips, after which it sharply retreated to its starting positions and entered a wide sideways range. This is a typical reaction to confusion.
On September 15, 2015, data released indicated a significant decline in retail sales, down 0.1 percent compared to 0.6 percent in the previous month. Logically, one could conclude that the US economy has deteriorated significantly, so a real decline in the USD/JPY pair is expected. The impact of this news can be seen in the image below:
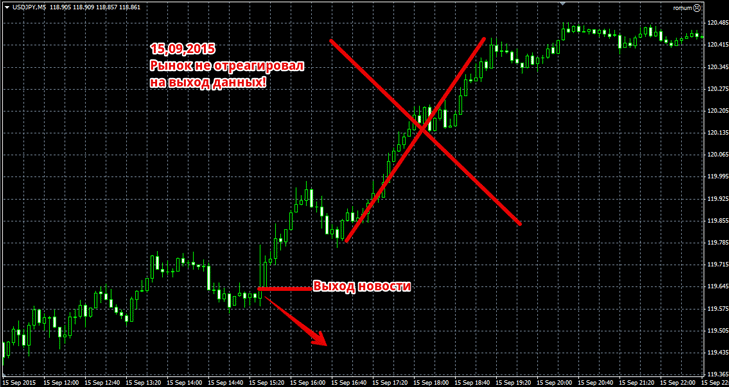
The image above shows a classic example of the market ignoring a news release. Not only did the market simply fail to react, but the price also formed a new microtrend. This is a typical situation where the significance of the news is simply exaggerated.
On October 14, 2015, further negative data was released, showing a decline in retail sales, down 0.3 percent from -0.1 percent. It's entirely expected that the weakening USD would send the USD/JPY pair sharply lower. The actual reaction to the decline in retail sales is shown in the image below:
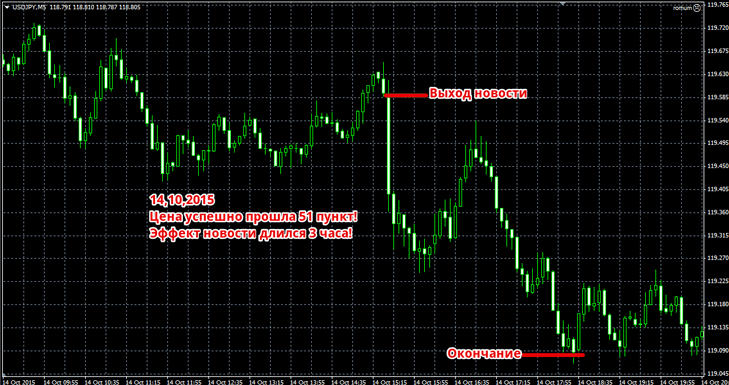
The market reacted quite strongly to the economic deterioration, so you can see a sharp 51-point drop in the chart. The price moved halfway in three candles, after which you could see a slowdown, a pullback, and a resumption of movement in the direction of the news. The market raged for three hours.
Summarizing the analysis based on historical data, we can confidently say that the significance of this news for the Forex market is slightly exaggerated, so when trading, you shouldn't expect trend reversals or rapid rises and falls of 100 or more points.
This news can be considered a high-speed move because the price goes through almost the entire movement in the first 15 minutes, after which, as expected, it rolls back and returns to its original positions. Mathematically, if you had set a 17-point target and limited your risks to the same amount, your total profit would have been: 17 + 17 + 17 - 17 = 34 points.

