New Zealand Producer Price Index. Impact of the news on the NZD/USD currency pair
Data on national currency inflation are always taken into account when making long-term forecasts for  exchange rate changes.
These are some of the indicators that make fundamental market analysis more effective.
Moreover, it doesn’t matter which instrument you work with—dollar, euro, or franc—inflation data always has a significant impact on the chart’s movement.
Since the inflation indicator almost certainly helps a trader predict the possible movement of a currency pair, draw conclusions about the economy, and put together a general picture.
The New Zealand Producer Price Index is a leading indicator that can provide a high level of accurate indication of inflation.
To calculate it, they take data on manufacturers' costs for materials, semi-finished products, and components.
Therefore, this news has a very high leading effect, since such simple calculations of the difference in prices of raw materials can be used to obtain this index before the release of official data from the central bank.
Using the index in trading is very simple. If the data is higher than the previous month, it's a good sign of declining inflation, a strengthening economy, and, consequently, a rise in the NZD exchange rate.
If the news release is lower than the forecast or previous figure, it's a sign of deterioration in the country's economy, rising inflation, and ultimately a weakening of the NZD. Therefore, monitoring this news offers an excellent opportunity to profit from sharp price movements.
Every practicing trader should be primarily interested in how the price behaves after the release of the New Zealand Producer Price Index data, how often the price ignores the data release, whether there are false signals, the average number of points the price moves after the data release, and how long the chart fluctuates.
The most popular currency pair for trading New Zealand news is NZD/USD, as it reacts well to news when paired with the dollar and has a tight spread. To understand the market's real reaction to the news, I suggest looking at the price action of the last four indicators historically.
On November 20, 2014, negative data for the Purchase Price Index was released, reaching -1.5 percent. Most analysts were expecting a rise from -1 percent to 0.3 percent. However, facts are facts, so based on the negative data, one can assume that the NZD/USD currency pair will plummet. The actual price action can be seen in the image below:
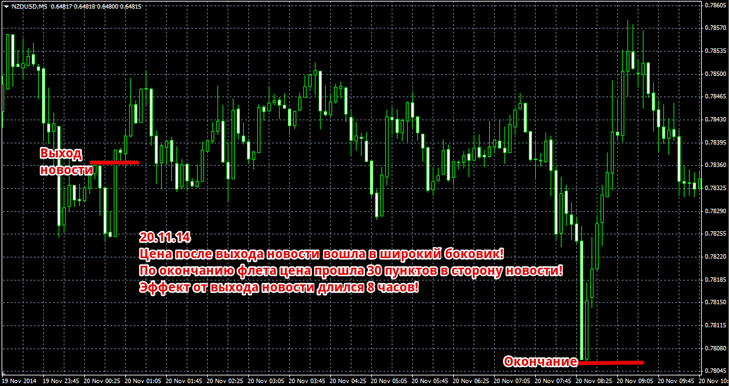
Judging by the chart, it's clear the market simply ignored the news and entered a wide sideways range. However, a few hours later, the price broke out of the range and closed a distance of 30 pips. Speaking of the news's effect, it clearly lasted for eight hours, with the market not reacting at all for the first four.
On February 19, 2015, the released CPI data was lower than experts had predicted, coming in at -0.4 percent versus the expected -0.2 percent. However, looking at the previous figure, which was -1.5 percent, it becomes clear that the inflation rate has declined.
Therefore, this positive news should cause the NZD/USD currency pair to move higher. This can be seen in the image below:
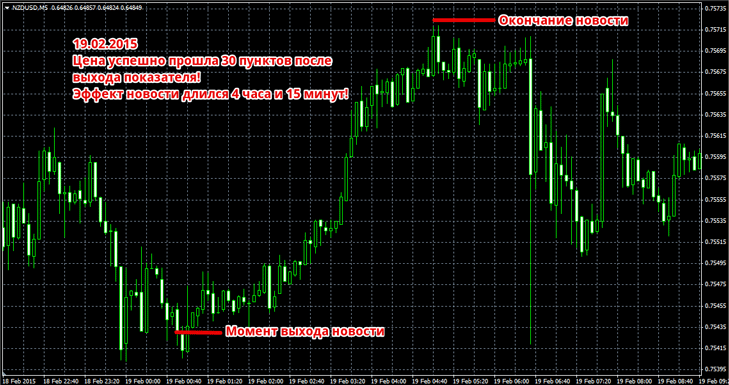
The price responded successfully to the positive data and moved 30 pips. The news's impact lasted approximately 4 hours and 15 minutes. The news ended with practically a single large candlestick, covering the entire distance traveled.
On May 19, 2015, data was released showing rising inflation. Most forecasters expected the decline to be no higher than -0.7 percent, but the actual reading was -1.1 percent, compared to -0.4 percent for the previous quarter. This suggests a weakening of the New Zealand economy, which should be reflected in a decline in the NZD/USD currency pair. You can see the actual reaction to the PPI in the image below:
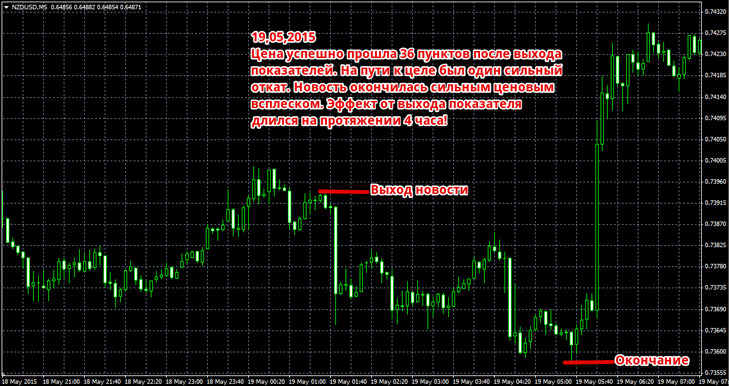
The market reacted to the data release, and the price successfully moved 36 points in the direction of the news. It's worth noting that the news's impact lasted four hours, with the main price movement occurring in the first 15 minutes, followed by a pullback and continued movement. The end of the news was marked by a strong price surge, which covered the entire distance traveled in a single candle.
On August 19, 2015, the PPI indicator was positive. While the previous reading was -1.1 percent, the actual reading was -0.3 percent. This suggests a decline in inflation, so the NZD/USD pair should rise sharply. The price action can be seen in the image below:
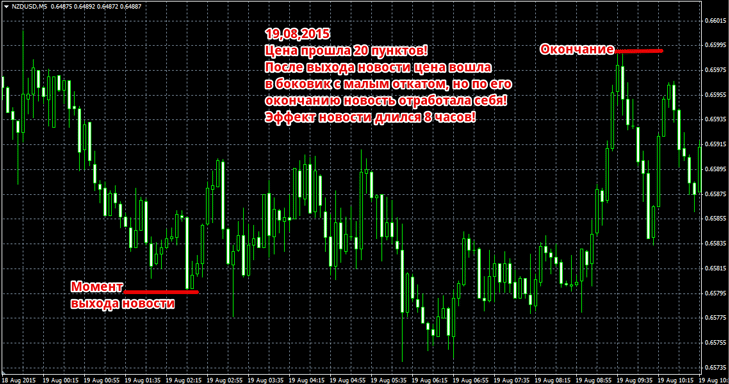
At the news release, the price made a small jump, then entered a prolonged sideways trend. After the flat, the chart moved steadily upward in the direction of the news, moving 20 pips. The impact of the news release lasted for eight hours.
In summary, I'd like to remind you that the news is released after midnight, so don't expect a strong reaction at this time of day. Despite this, the PPI data will impact the NZD/USD pair for almost the entire night, or at least for four hours.
If we talk about the profitability of trading on this news, then if you traded with a stop order and a profit equal to the minimum distance traveled, then in four trades you would earn 20 + 20 + 20 + 20 = 80 points!
Since there are virtually no real dollar players at the time of the news release, the price action around the release of the indicator is quite predictable and without any significant price spikes. View the news on the economic calendar at http://time-forex.com/kalendar

