Japan Industrial Production: Impact on USD/JPY
Industry is the engine and heart of any country's economy. Unlike  many other countries, Japan is heavily dependent on the development and stability of its industrial sector, as the number of factories involved in industrial production is enormous.
Just look at the brand names of Japanese automobile manufacturers, special-purpose vehicles, and various industrial equipment that are supplied to all corners of the world.
Economic policy in Japan is also aimed at developing the industrial sector and supporting the industry as a whole, since the Central Bank of Japan deliberately understates the national currency in order to make industrial goods competitive and gain a price advantage over producers in other countries.
For example, take a good brand of Japanese car and find an identical German car equivalent. With the same quality components, the prices will be simply astonishing.
Industrial production in Japan is calculated by collecting data on the output of various factories, mines, and utilities. This news item allows you to monitor the overall situation in the industrial sector. Since industry is the heart of the Japanese economy, it allows you to assess the overall economic situation and predict possible fluctuations in the country's currency.
For an investor, this indicator is one of the main ones when deciding whether to invest money in Japan or not.
Industrial production volume and the US dollar to yen exchange rate.
Since we are not investors and do not need to make global plans, we as traders should be primarily interested in how the price behaves at the time of the news release, the approximate distance the news travels after publication, and the time during which the main effect can be observed.
For this calculation, the four most recent release dates of the indicator were used, and the overall impact of the news was clearly illustrated using examples of the USD/JPY currency pair.
On August 12, 2015, positive data was released indicating an increase in Japanese industrial production.
Many analysts predicted a 0.8 percent rise, but the actual reading was 1.1 percent. This should have been reflected in a decline on the USD/JPY chart, as the dollar weakened against the backdrop of the JPY data. You can see the true picture of what was happening at that time below:
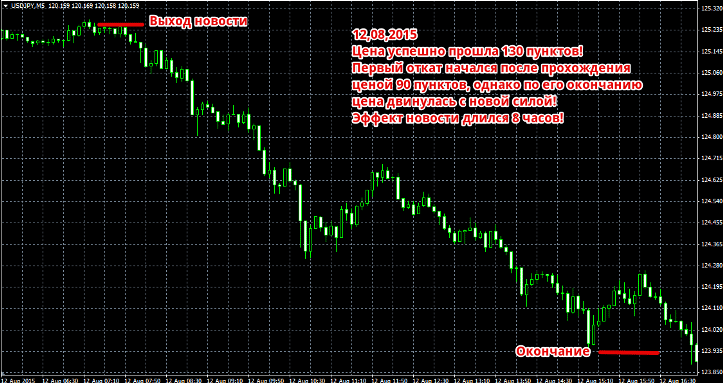
The news worked brilliantly, capturing a 130-point profit. Along the way, there was only one strong pullback, after which the price moved downward with renewed vigor. The impact of the data release lasted for eight hours.
On August 31, 2015, the latest Japanese industrial production figures were released, which were negative. While the previous figures showed growth, this one saw a decline from 1.1 percent to -0.6 percent. On the USD/JPY chart, this news should be reflected as a rise, as the dollar strengthens against the JPY. The actual picture can be seen below:

The chart shows that a strong downward trend in the dollar had formed at the time of the news release, so the price was only able to move 12 pips after the news was released. This distance was covered in 10 minutes as a pullback from the main movement, after which the price continued to move in line with the trend.
On September 14, 2015, most traders and experts were inclined to believe that the industrial production decline would remain at the previous level of -0.6 percent, but it actually declined again to -0.8 percent. Therefore, it can be assumed that the USD/JPY currency pair will begin to rise, driven by the weakening of the JPY. The actual picture of what happened can be seen below:
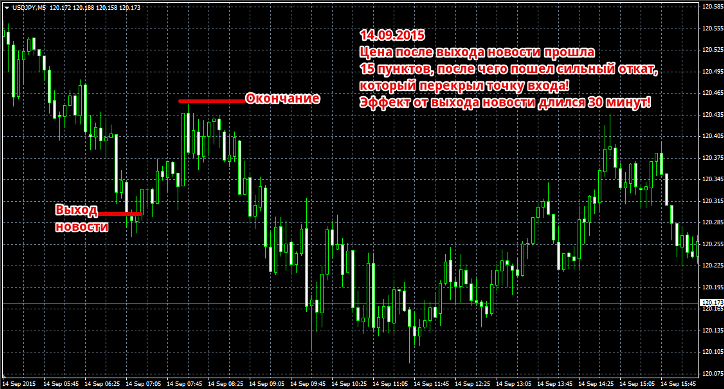
The example shows that this news was counter to the new trend, so its effect was insignificant. Despite this, after the indicator's release, the price successfully pulled back from the main trend and moved 15 pips, with the news's effect lasting for 30 minutes.
On September 30, 2015, the industrial production data came as a surprise to many. Following the previous decline, almost everyone had predicted industrial production would rise from -0.8 percent to 1 percent.
However, expectations proved false, as instead of the expected large gain, the actual result was -0.5 percent. On the USD/JPY chart, this should have been reflected as a rise in the price, as the dollar strengthened amid weak JPY news. You can see the real picture in the image below:
The example shows that the price successfully covered a distance of 18 points. The news's impact lasted for 1 hour and 30 minutes, after which a strong pullback occurred, with the price moving beyond the opening point. Of course, the chart shows that after the pullback, the price continued to move in the direction of the news, but the pullback was so strong that you would have been knocked out by a stop loss if you had been buying.
Now let's sum up some results.
Although most traders pay special attention to this indicator, in reality, it has little impact on the USD/JPY currency pair chart. Of the four examples, only one recorded the price exceeding the 20-pip distance.
It's worth noting that this news item is suitable for scalpers, as the distance the price travels after the indicator's release is too short. In simple terms, if you used a stop loss and profit equal to the minimum distance the chart traveled after the news release in the four examples, you would get the following figures: 12 + 12 + 12 + 12 = 48 points from four positions.
You can find out when the industrial production index changes in the economic calendar - http://time-forex.com/kalendar

