US GDP and EUR/USD pair.
The release of US GDP data has an undeniable impact on all currency pairs involving  the dollar. Any textbook on investing or stock trading places a great deal of emphasis on the GDP figure.
Moreover, after reading information about the possible impact of GDP on the dollar exchange rate, the opinion that this is 100% news, on which almost everyone makes money, is smoothed out.
After attending courses that teach fundamental market analysis, you'll also be taught how to make large sums of money by publishing this data, spending just a few minutes analyzing this indicator.
But is this really true? Does this news really work out the way almost every trading gurus and various training textbooks claim?
First, let's briefly recap what GDP means and why it's important for any trader. GDP is primarily a macroeconomic indicator that reflects the value of all goods and services produced and provided in a given country, and in our case, we're looking at the United States.
The indicator is released quarterly, or, in simpler terms, every three months. However, updated data is released monthly, showing the dynamics of the country's GDP. In fact, most traders base their trading on monthly data.
What is the value of this indicator?
First and foremost, it shows the rate of economic growth or, if the indicator worsens, its regression. Why does the indicator reflect the rate of economic growth? Its calculation is based on the value of four main categories: consumer goods, investment, government revenue and expenditure, and net exports.
We could go on and on about which expenses fall into each category, but I think it's clear that this indicator covers the entire national economy. Therefore, the release of US GDP data has a profound impact on the decisions of both investors and traders, and this is especially noticeable at the time of the news release.
In order to understand whether the news really works as everyone says, I suggest looking at the data on the last 4 indicators of US GDP and modeling the probability of profit or loss if we were trading on the EUR/USD currency pair.
We will only take into account the number of points that the chart passes for positive and negative data, and we will also calculate the time frames in which the main movement is observed.
June 24, 2015, was a day remembered with mixed feelings by many. Analysts had predicted GDP growth would drop from -0.7 percent to -0.2 percent, which is precisely what happened. But many were unsettled by the negative figure, which, no matter how you look at it, indicates a deteriorating economy.
Therefore, one wouldn't expect a strong market reaction from this news. However, compared to the previous indicator, there's a noticeable improvement, so one would expect to see a decline in the EUR/USD currency pair. The reaction itself can be seen in the image below:
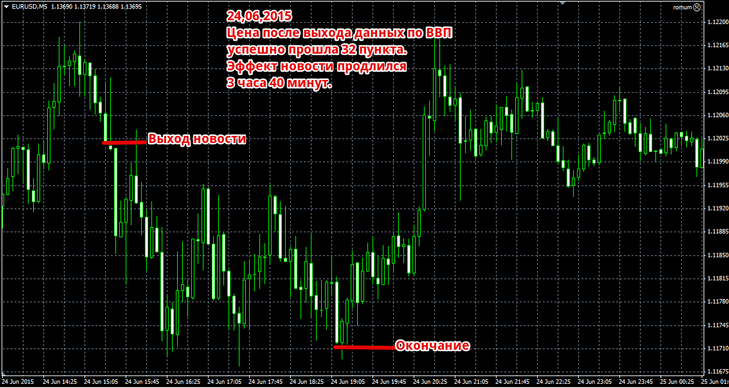
Despite its significance, the news had a very weak impact, moving only 32 points over 3 hours and 40 minutes, with the main movement occurring on the first candle. After the news ended, a strong price surge was observed, bringing the news back to its original point.
On July 30, 2015, analysts' forecasts were effectively fulfilled, and we saw GDP growth rise from 0.6 percent to 2.3 percent. Such a rapid increase in the indicator couldn't have gone unnoticed by market participants, so we should see a sharp decline in the EUR/USD pair, as the euro simply pales in comparison to the positive USD data. The chart's behavior at the time of the news release is shown in the image below:
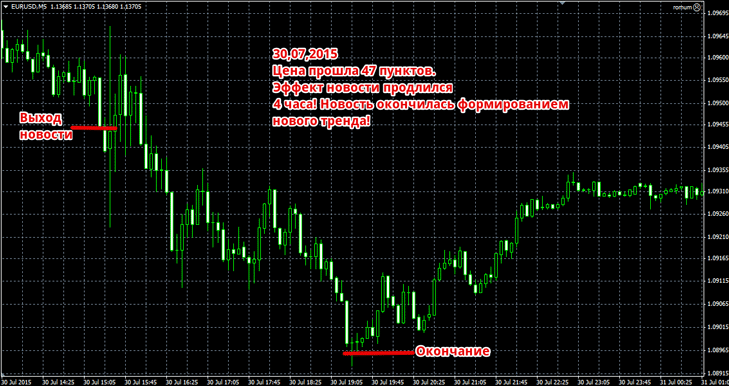 The market initially reacted ambivalently, moving somewhat contrary to the news, but 15 minutes later, the market responded to the data release and moved the price 47 pips. This pattern continued for four hours, after which a new trend emerged.
On August 27, 2015, US GDP data came out more positive than expected, as while the previous month's growth was 2.3 percent, the actual figure was 3.7 percent. Therefore, it was entirely expected that the EUR/USD chart would steadily decline. The price action at the time of the news release is shown below:
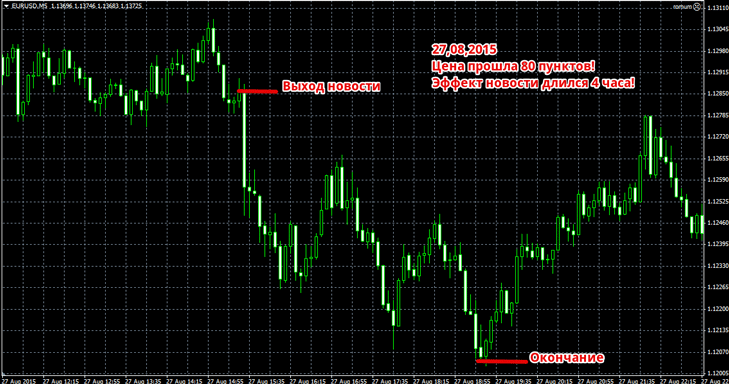
The market reacted fully to the news, moving 80 points in four hours. The news ended with the formation of a new trend, as in the previous two versions.
On September 25, 2015, the US GDP figure was 3.9 percent, up from the previous 3.7 percent.
By all laws of logic, the EUR/USD currency pair should be heading downward, as we have an excellent signal of US economic growth. The market's reaction is shown in the image below:
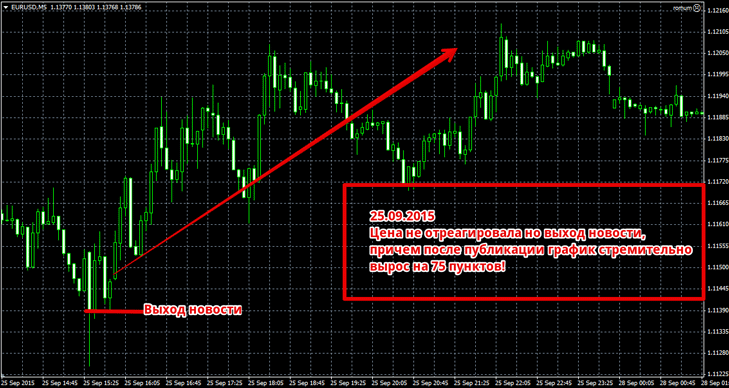
The chart shows that the market has not reacted to the news at all, and in addition to the lack of a reaction in the desired direction, we can observe a 75-point rise in the currency pair, which defies all logic.
In conclusion, it is safe to say that we are often misled by the idea that news always works out and leads to a strong movement and a trend reversal.
In fact, we saw that of the four scenarios, only three of them followed the planned price path. The news's impact lasted no more than four hours, and afterward, a new trend formed, opposite to the data obtained. In terms of the profitability of the news, four trades with a 30-point profit and the same loss would yield approximately the following figures: 30 + 30 + 30 - 30 = 60 points of profit.
This is a rough calculation without using a trailing stop, which would allow you to squeeze more out of the market, but it fully reveals the potential for risk-free trading on this indicator on the EUR/USD currency pair.

