
Fibo Levels Indicator - Trade Channel
The mathematical approach in market analysis is one of the most common, since any strategy is based on the analysis of statistical data, as well as the correct formula for the distribution of capital and risk.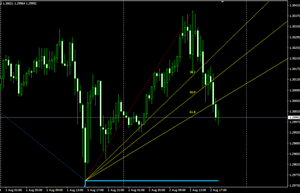
However, behind dry mathematical calculations you can often find the use of so-called magic numbers, often referred to as Fibonacci numbers.
A rather interesting relationship between the proportions of various bodies in living and inanimate nature, which was repeated many times and had the same numbers, excited the minds of many mathematicians.
Naturally, such mysticism did not escape the Forex market, since similar percentage ratios began to be used to analyze the behavior of the crowd, and most importantly, to determine the degree of market correction.
All these tools require the trader to plot them on the chart themselves. As a result, many beginners not only practically do not understand the essence of such tools, but also use them completely incorrectly.
Trade Channel is an indicator of Fibonacci levels, which independently builds on the chart such a trend instrument as “Fibonacci Ver”, as well as on its basis a global price channel , which allows you to visually track how the price moves in the range.
This Fibonacci level indicator is almost the only working version of the Fibonacci fan.
A special feature of the tool is the construction of two fans simultaneously, which allows you to analyze the depth of the rollback, both for global price movements and for micro trends. The tool itself is an assistant, so the tool can be used on any currency pairs or time frames. The indicator will be especially useful to all practicing traders who want to automate and facilitate trading using Fibo levels.
Installing Trade Channel
Trade Channel is a custom assistant indicator.
Therefore, it is not in the official MT4 library, and in order to use it you will need to follow the standard procedure for installing technical indicators through the data catalog. First of all, go to the very end of this page and download the file of the Trade Channel indicator itself.
The next step is to enter the terminal data directory, which you can launch in your MT4 trading terminal using the file menu. When you open the data directory, and a list of system folders appears in front of you, find among them the name Indicators.
Log in and place the previously downloaded Trade Channel Fibonacci Levels indicator. It is very important after the installation itself to either update the terminal in the panel called “Navigator”, where the list of custom indicators is actually presented, or completely restart the platform.
Otherwise, this script will not appear in the list. To start using the indicator, drag its name onto the asset of your choice. You will get this look:
 Application in Forex trading
As we have already noted, Trade Channel can easily be called an assistant, since it automatically plots a tool such as the “Fibonacci Fan” on the chart.
This structure looks like three rays with the captions 38.2;
50; 61.8. In fact, each of the rays is the strongest support level for the trend, and the captions indicate what percentage of the main trend the rollback occurred. You need to know that 61.8 is considered to be the strongest level, since overcoming it indicates the degeneration of the rollback into an independent new trend.
The Fibonacci fan is an excellent tool for trading after a correction towards the global trend.
Thus, if on an ascending fan the price drops and touches one of the rays, especially 50 or 61.8, it is necessary to open buy positions. If, on a downward fan, the price rises and touches the level of 50 or 61.8, you need to open a sell position in the direction of the continuation of the trend. A simple example of trading in the direction of the trend:
 Also, in addition to trading on pullbacks, a trader can use the construction of a fan to record a trend change and implement signals for a new trend.
As we have already noted, the key level that indicates a change in trend is precisely 61.8.
So, if the ascending fan has broken through the ray 61.8 from top to bottom, we open a sell position. If the downward fan has broken through the ray 61.8 from bottom to top, we open a buy position. It is also important to wait for confirmation of the breakout, when the price, after a strong jerk, rolls back to the line and continues its movement towards the new trend. A small example:
Trade Channel is one of the few indicators that can automatically plot the Fibonacci fan on the chart.
However, we should not forget the fact that the tool is primarily an assistant, so it is necessary to carefully study its construction and monitor its work.
Download Trade Channel
Some more useful materials on the topic:
Fibonacci strategy - http://time-forex.com/strategy/st-fibonashi
Advisor for automatic trading on Fibo - http://time-forex.com/sovetniki/fibo-martin