Fibonacci Strategy: Combining the Fibonacci Fan and MACD
Italian mathematician Fibonacci made an invaluable contribution to the development of technical  analysis and helped more than one generation of traders achieve success with his tools.
Tools such as Fibonacci lines, arcs, zones, and fans are integral parts of many trading strategies.
The magical effect of these numbers and the processing of signals shatters into pieces all the claims of traders who use fundamental analysis about the ineffectiveness of technical analysis.
The Fibonacci strategy we want to offer you today is based on the Fibonacci fan and MACD.
For some reason, the fan chart isn't particularly popular among traders, as some beginners have difficulty constructing this tool and interpreting trading signals.
In fact, constructing the tool is very simple: you'll need to find the minimum point (trend minimum) and the maximum point of the formed movement and draw a fan through them. However, at this stage, you don't even need to know this, as there are indicators that will do all the work for you automatically.
In general terms, to apply this strategy you will need the MT4 terminal, and trading can be conducted on any instrument, including metals and CFDs, as well as stocks or futures.
Preparing a Fibonacci Strategy Worksheet
As mentioned, you can use the Fibonacci Fan yourself by drawing it through the minimum and maximum. However, to simplify the process of drawing and preparing for use, I suggest downloading and installing an indicator that draws lines automatically, as well as a template that will make your desktop fully operational when launched.
To do this, install the tools downloaded below into your MT4 via the data folder, which you can open via the File menu in your terminal. Next, install the indicator in the Indicators folder and the template in the Template folder.
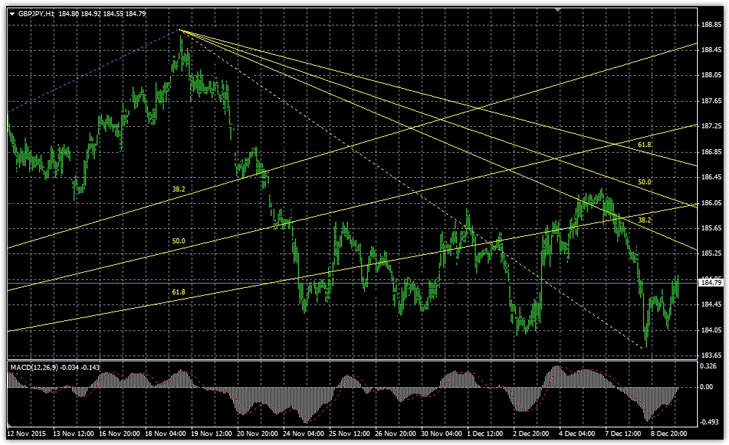
After updating your installed tools, go to your templates list and open "Fibonacci Strategy." If you followed the instructions, your work schedule will change as follows:
Signal Types. Briefly about TS
If you've ever studied a Fibonacci fan, you're probably already familiar with its primary purpose of showing potential reversal points after a trend correction. Therefore, traders typically trade primarily on rebounds from the fan's rays.
However, we shouldn't dismiss the fact that a fan breakout of the last ray provides an excellent entry point for a market reversal. This is why the Fibonacci strategy divides signals into two blocks: a continuation of the main trend (price rebound from the rays) and a breakout of the last ray (trend reversal). Let's start with the second block.
To confidently say that the bearish trend has reversed and enter a buy position, the following conditions must be met:
1) The price broke through the ray of the descending Fibonacci fan with the value of 61.8 from bottom to top.
2) At the moment the price breaks through the beam, the MACD indicator is strictly above the 0 level.
When trading, it's best to wait for the candle to close before entering a position, as the MACD is an oscillator and its values are as dynamic as the price itself. A breakout of this line is typically accompanied by a sharp move. An example of a trend reversal and a buy position is shown in the image below:
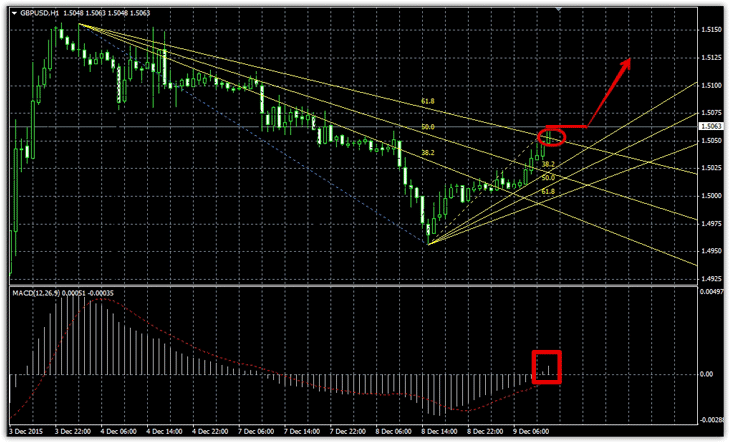 To confidently say that the bullish trend has reversed and enter a buy position, the following conditions must be met:
1) The price broke through the ray of the ascending Fibonacci fan with the value of 61.8 from top to bottom.
2) At the moment the price breaks through the beam, the MACD indicator is strictly below the 0 level.
When trading, it's best to wait for the candle to close before entering a position, as the MACD is an oscillator and its values are as dynamic as the price itself. A breakout of this line is typically accompanied by a sharp move. An example of a trend reversal and a buy position is shown in the image below:
 When using a strategy for trading on a rebound from the fan rays, the following conditions must be met to trigger a signal to enter a buy position:
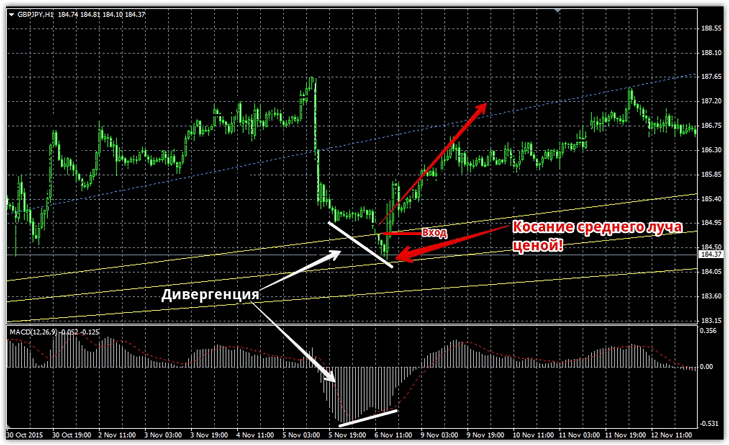
1) On the ascending Fibonacci fan, the price touched the middle ray with a period of 50 or the first extreme ray with a period of 38.2.
2) The MACD indicator formed a divergence below the 0 level.
As a reminder, divergence is the difference between the peaks shown by indicators and the actual price. For example, the MACD histogram shows a higher value for the current price movement, even though the previous price movement was actually higher. See the example below:
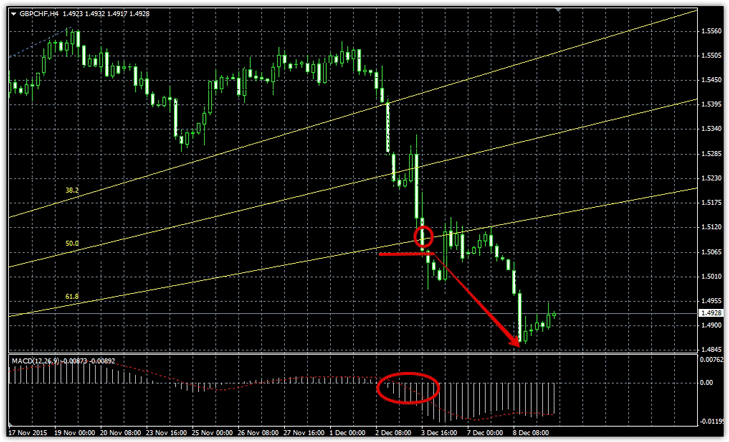
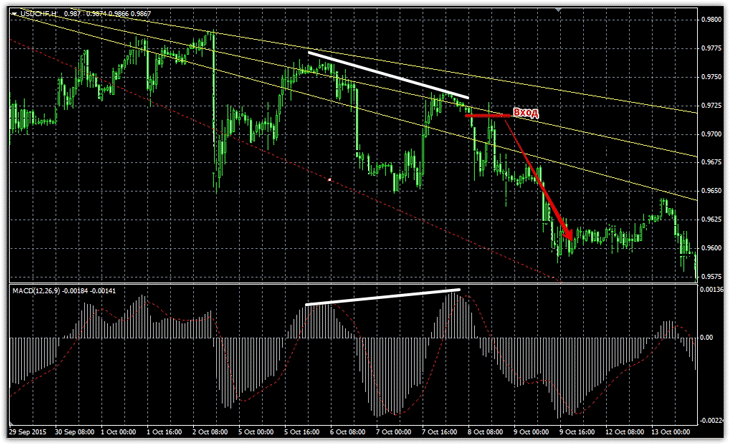
 To receive a signal to enter a sell position, the following conditions must be met:
1) On the descending Fibonacci fan, the price touched the middle ray with a period of 50 or the first extreme ray with a period of 38.2.
2) The MACD indicator formed a divergence above the 0 level.
An example of a sell entry is shown below:
Capital management and setting stop orders.
Despite the two different configurations of the strategy—trend following and trend reversal—the number of signals will be limited. To limit losses in the event of a losing position, set stops near the adjacent Fibonacci fan or at local highs and lows.
Remember, proper lot calculation allows for smooth profit growth and minimal losses. Therefore, try to calculate your lot size so that, in the event of a negative outcome, the loss on a single trade does not exceed 2 percent.
Download the necessary tools for the Fibonacci strategy.

