First RSI level
When trading with oscillators such as RSI or Stochastic, sooner or later you will encounter the problem of indicator lines getting stuck in overbought and oversold zones.
At such moments, the price actively continues to move in the direction of the trend, while the indicator points to a reversal.
Many consider this phenomenon a major drawback and combat it by changing calculation periods and supplementing the script with other technical analysis tools.
However, there are also traders who have conceptually turned this disadvantage into an advantage. The First RSI Level script is a striking example of one such indicator for Forex.
The First RSI Level indicator is a conceptually new technical analysisbased on the so-called theory of pushing through overbought and oversold RSI zones.
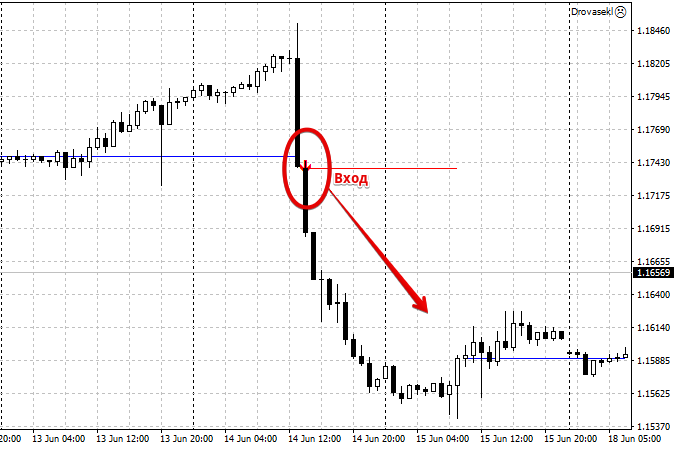
Essentially, the First RSI Level identifies trend baselines, upon the breakout of which a trader can open positions in the direction of global markets.
It's also worth noting that the First RSI level is extremely convenient for trading, as the tool indicates all entry points directly with an arrow on the chart.
Installing the First RSI level indicator
Until recently, First RSI level was a hot seller on the market, but in 2018, the developer released the open source code for the tool in the official MT4 developer library.
This allows you not only to use it completely free of charge, but also to refine the indicator if necessary.
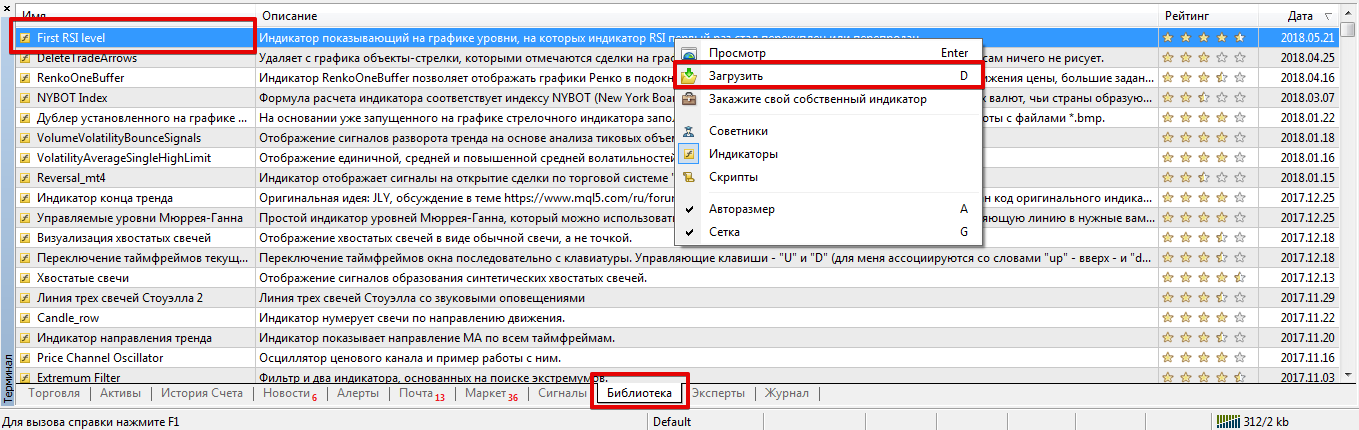
There are several ways to install the indicator. First, you can install it through the library. To do this, navigate to the "Terminal" panel, where you can find information about your balance and open trades.
Then open the "Library" tab and sort the list so that it contains only technical indicators. Find the tool called First RSI level in the list and download it using the additional menu as shown in the screenshot.
The second method is considered classic, as it's done using your trading terminal's data directory.
To do this, go to the end of the article and download the indicator file. Then, place it in the appropriate folder in your terminal's data directory, specifically the "Indicators" folder.
Regardless of the installation method, after installing the indicator, be sure to update your trading terminal using the navigator panel or by restarting it.
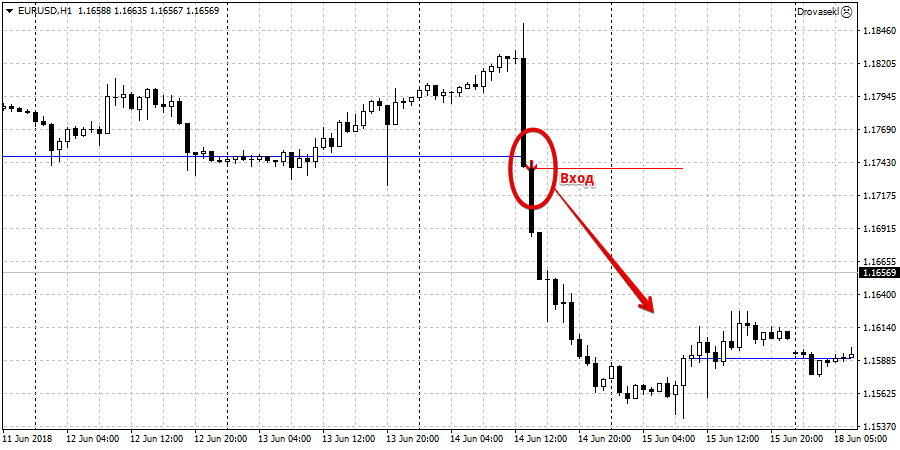
After updating, the First RSI level will appear in the list of indicators, and to use it, simply drag its name onto the chart of the selected currency pair.
Operating principle. Signals
As we've already noted, the First RSI level is based on a completely new and completely opposite concept to the RSI indicator.
This indicator marks peak RSI values on the chart, specifically the zones where the indicator line has reached a maximum while being overbought or oversold.
Then, if the price breaks through this price level, the indicator detects a breakout of the overbought or oversold level and, instead of triggering a reversal signal, displays an arrow pointing in the direction of the breakout.
Thus, it is very simple to use the indicator in practice: if the price breaks through the level and an upward arrow appears, we open a buy position, and if the price breaks through the level from top to bottom and a downward arrow appears, we open a sell position.
If the level is broken but the arrow still doesn't appear, the signal is ignored.
indicator
can be easily customized to suit any trader's preferences and needs.
For example, in the RSI Period field, you can change the calculation period of the main RSI indicator. The RSI Maximum Level and RSI Minimum Level variables can be used to change the overbought and oversold levels, the intersection of which is indicated by a level on the chart.
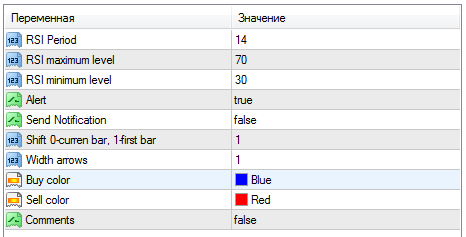
The Alert line enables a sound alert when a new signal appears, and the Send Notification line allows you to enable push notifications to your mobile platform. The Width arrows variable controls the size of the arrows, while the Buy color and Sell color variables control their color.
Finally, the First RSI level indicator offers a completely new approach to the standard RSI, allowing you to identify strong areas of a trend movement near its base.
Download First RSI level.

