The Cayman Indicator – Trading Against the Crowd
There are various forex strategies and indicators designed for trading against the crowd in the Forex market. 
This is not surprising, as this strategy can lead to significant profits. However, it also carries increased risks.
Therefore, to truly profit from trading against the crowd, reliable forex indicators are essential.
One such indicator is the unique Cayman indicator. What is this script for, what principles are behind it, and how can it help traders?
What does it mean to trade against the crowd?
Despite the diversity of strategies and tools for technical or fundamental analysis, most traders move in the same direction. Consequently, they all achieve the same, disappointing results.
According to statistics, 95% of traders lose their money. Meanwhile, the remaining 5%, who spotted market changes early, make the same amount as all the losers.
The counter-trading strategy is based on the premise that it's impossible for everyone to be right in the market. That is, there can't be 100% buyers or sellers.
Therefore, when the market is bullish, meaning the majority of traders are buying, those who follow this strategy will open short positions.
Similarly, when the majority are selling, meaning they become bears, those who trade against the crowd will buy.
 To open a trade on the forex market, at least 60% of traders must be bullish or bearish. It's at these moments that a key reversal in the current trend can occur.
Therefore, when the number of buyers or sellers exceeds this threshold, counter-trend traders close existing positions to preserve their profits.
Then, depending on the market situation, they wait for a favorable opportunity, for example, until consolidation ends, or immediately open new counter-trend trades.
To understand where to open trades, it's necessary to be able to determine the overall market condition for a given asset. Simply put, having a tool that shows how many traders are buying or selling an asset and, accordingly, who is in the majority in the market.
There's no universal tool that reflects the state of the entire market, as Forex is a decentralized market. However, using indicators from a large broker with at least 100,000 traders can provide a general picture closer to the actual state of the market. After all, as we mentioned at the beginning, most traders act similarly.
One such broker is AMarkets. Tens of thousands of traders trade here, providing objective information on the overall market situation.
It's no surprise that this company developed the unique Cayman trading indicator, which allows you to stay on the opposite side of the market and profit when most traders are losing.
Characteristics and operating principle
The Cayman indicator doesn't just show the ratio of buyers to sellers; it also shows potential market highs and lows, making it possible to determine the most likely location of a key turning point. This, in turn, allows traders to enter the market against the crowd at the very beginning of a new trend and take advantage of the movement.
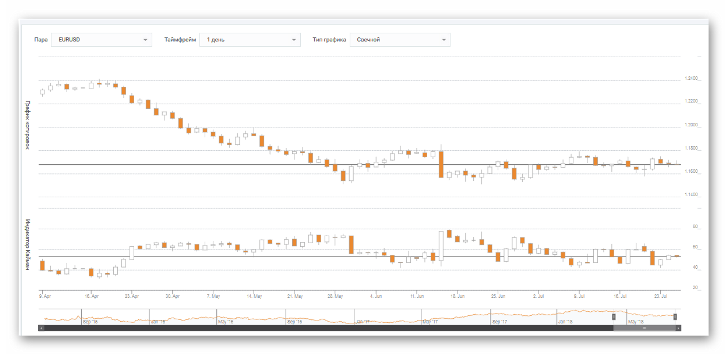 The screenshot shows the EURUSD currency pair chart above and the indicator chart below.
While it may seem confusing at first glance, it's actually quite simple.
Technical specifications:
The indicator supports the following pairs: EURUSD, GBPUSD, USDJPY, AUDUSD, NZDUSD, USDCAD, USDCHF, EURJPY, EURGBP, XAUUSD, and XAGUSD.
The indicator has a fixed range from 0 to 100.
The price moves within these values and never reaches them.
There are internal levels that can be set in the range from 1 to 99.
The indicator's values are most effective on daily and weekly charts.
Operating principle:
The indicator has its own extreme values. These are considered maximum levels of market sentiment, but it's important to keep in mind that different currency pairs have different levels.
For example, if the EUR/JPY pair previously reversed when the buying level reached 75%, then in all likelihood, this level is critical for it. Accordingly, you should monitor this level.
Most likely, the price will reverse the next time the indicator approaches this level.
However, if, for example, the US dollar/Australian dollar pair reversed near the 25% sell level, this level would be extreme for it. Therefore, this level should be set for this pair and monitored.
Ranges from 0 to the critical 25% level indicate oversold conditions. If the Cayman indicator enters this zone, we can expect an upward reversal of the currency pair. Accordingly, a range from 75% to 100 indicates overbought conditions. When the indicator enters this zone, it's time to prepare to sell.
Let's take the EURUSD daily chart as an example. Its critical levels are 30 and 70:
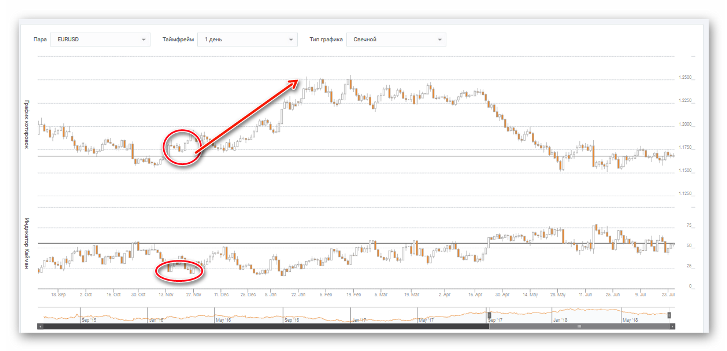 The screenshot shows how the indicator entered overbought territory on November 13 and 27, reaching levels of 25 and below, a critical level for this pair.
Accordingly, this could have been considered a strong signal for a correction or trend reversal if it had been a downtrend. However, since this was a correction on an uptrend, we received a signal for trend continuation, just when everyone had already believed in a reversal or a deep correction.
Such an entry could have resulted in a gain of 750 pips in three months. Had the trader closed at the first strong candlestick reversal signal,
where can I find the Cayman indicator?
Since the indicator was developed by specialists at AMarkets, it can only be found in the trader's personal account with this broker. There are several versions of the indicator:
Online version - https://www.amarkets.org/. The indicator is available in the trader's personal account after registration.
This indicator is for the MT4 trading platform.
The company has also developed the Cayman Expert Advisor. After installing the indicator in the terminal, using it becomes even more convenient than on the website. However, to use it, you must open a real account and deposit funds.
Please note that it is recommended to use this indicator in conjunction with other analytical methods or as an auxiliary one. Using the Cayman indicator in conjunction with other methods will significantly improve traders' trading.

