Bitcoin trading indicator
The immense popularity of cryptocurrencies is not only due to the incredible growth rates this asset boasts, allowing investors large and small to make significant profits simply by owning a precious coin.

In fact, cryptocurrencies exhibit the highest volatility, which implies diversified price movements over a given period of time.
Bitcoin, of course, leads the way in this volatility. This cryptocurrency is the primary focus of all speculative traders worldwide, and its unique dynamics allow for a wide variety of trading strategies.
In recent years, this asset has become a haven for traders using technical analysis and technical indicators.
Since the market is currently favoring technical analysts, we will examine a Bitcoin trading indicator in this article.
MACD + OSMA + STOCHASTIC 3XSIG MTF is a comprehensive technical analysis tool based on a number of standard forex indicators that allows you to assess short- and long-term Bitcoin trends and provide a range of accurate market entry signals.
Thus, this indicator can be considered a complete strategy that will allow for effective intraday Bitcoin trading.
Installing an indicator for Bitcoin trading
Despite the growing popularity of cryptocurrency trading, they have one significant drawback: their trading platforms are incomplete and only operate in web mode with a limited number of instruments.
In our case, the Bitcoin trading indicator is designed for traders trading through a broker on the professional MT4 trading platform.
Since the MACD+OSMA + STOCHASTIC 3XSIG MTF indicator is a custom indicator technical analysis tools, in order to use it you will have to go through the standard indicator installation procedure.
To do this, scroll to the end of the article and download the indicator. Next, you'll need to place the downloaded indicator file through the data directory into the corresponding folder in the terminal's data directory, specifically the folder called "Indicators.".
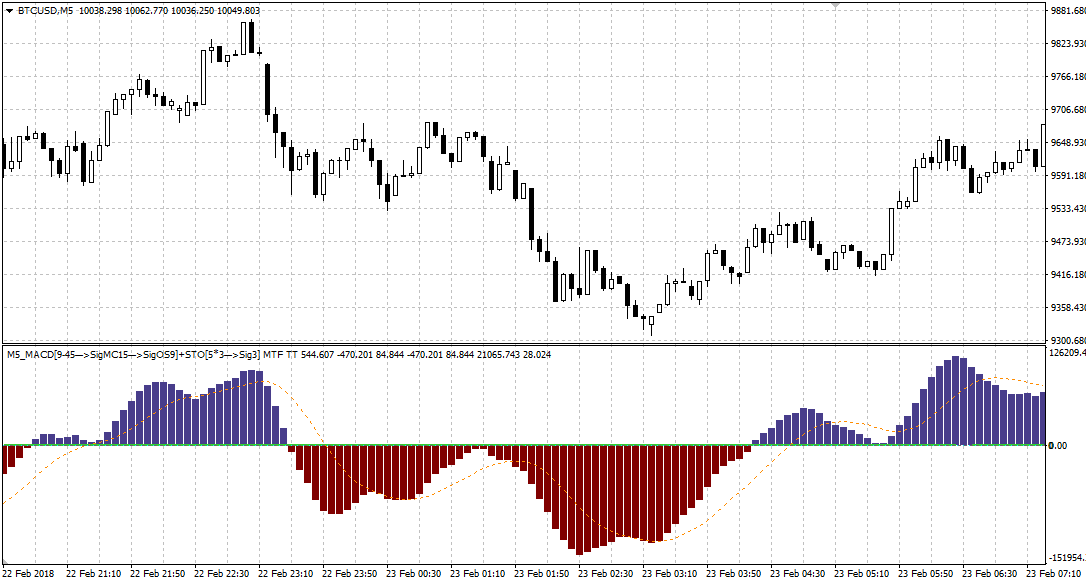
After installing the indicator, you'll need to refresh the trading terminal in the "Navigator" panel or even restart it for the indicator to appear in the user list. After applying the indicator to the Bitcoin chart, it will look like this.
Practical application of the indicator on Bitcoin
Since its inception, Bitcoin has demonstrated incredible growth rates and high volatility.
However, after the cryptocurrency market crash, when the price of Bitcoin fell below $10,000 for the first time in several years and has been hovering around it, compared to around $20,000 before the crash, volatility.
While this is less noticeable on longer timeframes, five-minute charts are full of battles and multiple reversals, which scalpers are adept at spotting.
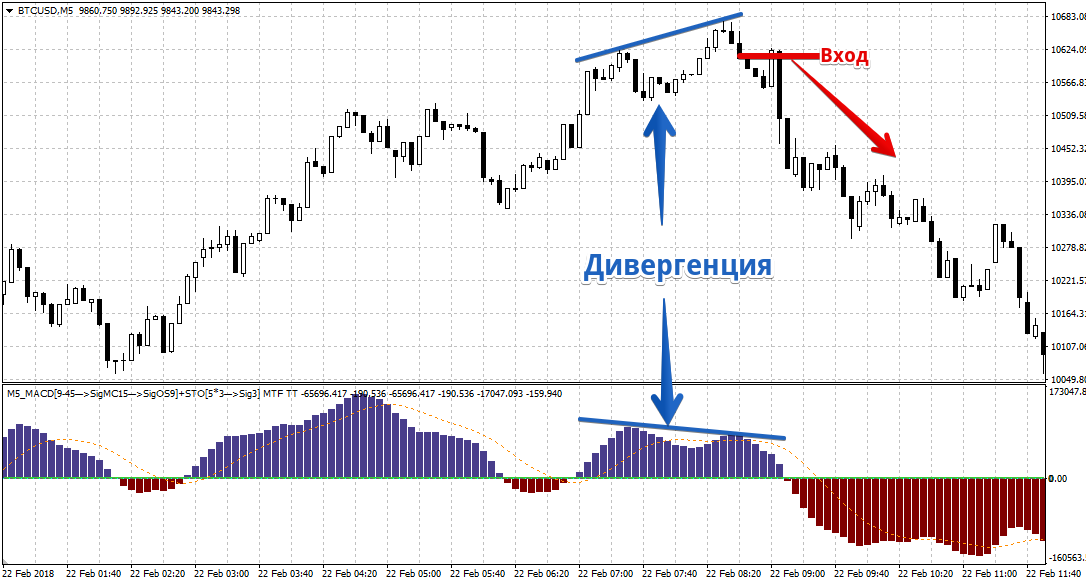
One of the strongest signals of a market reversal, provided by all oscillators without exception, is divergence.
Since Bitcoin is subject to turbulence like no other asset, divergences occur quite frequently and, most importantly, they are an excellent source of signals for scalpers. It's worth noting that divergence implies a discrepancy between indicator data and actual price action.
Therefore, a buy position should be opened if the histogram peak below the zero line is higher than the previous one, while the price is setting a new all-time low.
A sell position should be opened if the histogram peak above the zero line is lower than the previous one, while the price is setting a new all-time high. An example of Bitcoin divergence is shown below:
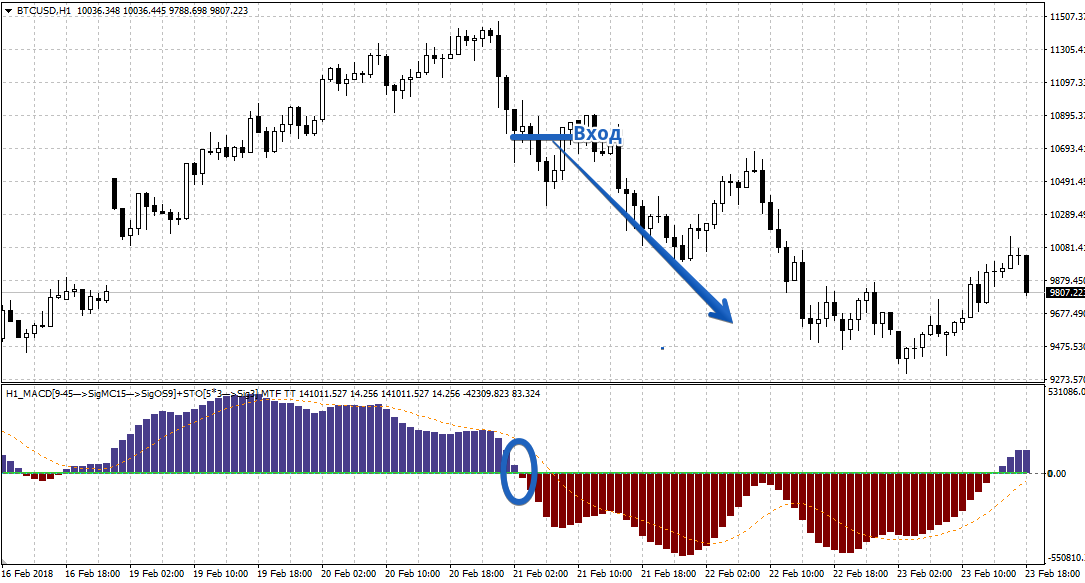
In addition to divergence, the Bitcoin trading indicator allows you to detect medium-term trend changes, which can also be successfully captured during intraday trading.
The indicator's zero line delimits the trend; a histogram above it indicates an uptrend, while a histogram below it indicates a downtrend.
Trading occurs when the trend change is detected: if the histogram breaks through the zero line from the bottom up and changes from red to blue, we buy.
If the histogram breaks through the zero line from the top down and changes from blue to red, we open a sell position. Example:
In conclusion, it's worth noting that the Bitcoin trading indicator we discussed in this article is, first and foremost, a universal tool.
Therefore, you can apply it to absolutely any cryptocurrency. Moreover, the indicator has proven effective not only on cryptocurrency but also on currency pairs and CFDs.
Download the Bitcoin trading indicator.

