Volatility indicator with increased efficiency
In the process of trading, probably every trader has encountered such a problem when, after opening a deal on a strategy signal, the price stops and flat.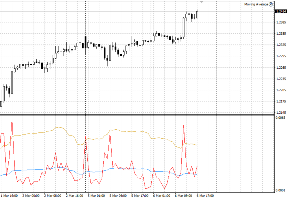
Unfortunately, in 90 percent of cases, these types of transactions result in losses for the trader, even if closed early.
A logical question arises: why is this happening? What is really missing from the strategy for it to be truly effective?
The answer is very simple and lies right on the surface - before opening a position you need to study market volatility!
This article will introduce you to a highly effective tool that will help you not only accurately assess market activity but also develop a momentum trading strategy.
The VolatilityAverageSingleHighLimit volatility indicator is a custom technical analysis tool that allows you to not only measure volatility based on the ATR indicator, but also provide a clear assessment of how strong the market activity is relative to its average value over a given period.
It's worth noting that volatility is a qualitative price characteristic, so the indicator can be applied to absolutely all trading assets, from currency pairs to metals or CFDs on stocks, futures, or indices.
The indicator can be used on a wide range of time frames, but it will be most effective on smaller time frames when used with scalping or pipsing strategies.
Setting up the VolatilityAverageSingleHighLimit volatility indicator
The VolatilityAverageSingleHighLimit volatility indicator is a completely new development, as the instrument was first introduced in 2018.
The tool itself is distributed completely free of charge; moreover, the indicator's author has placed it in the official MT4 developer library for everyone to see.
Therefore, you can install it in two ways, namely through the data directory using the standard scheme, or through the library without any downloads.
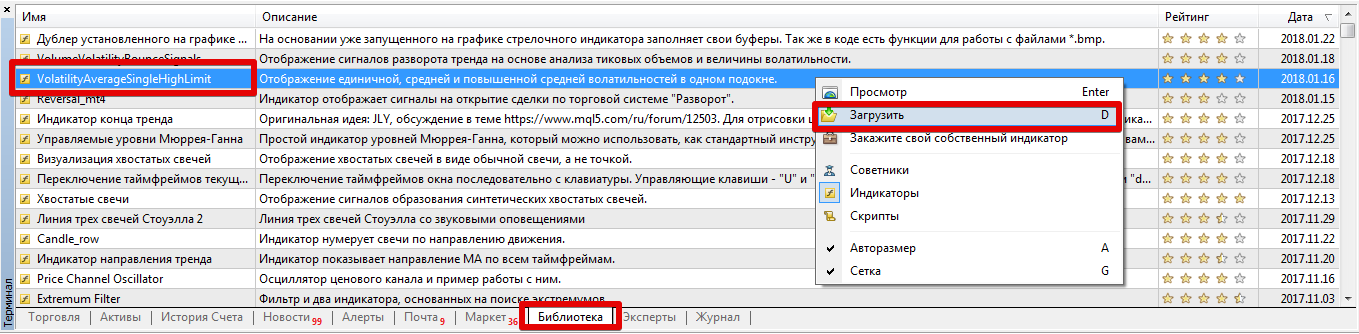
To install the indicator via the library, open your MT4 trading terminal and go to the "Terminal" panel, where you can find important information about your balance and open trades.
After this step, go to the Library tab, and then perform a simple filter so that the list contains only indicators and not mixed with scripts and advisors.
Then find VolatilityAverageSingleHighLimit in the list, and then use the additional menu as shown in the image below to download the indicator.
If the indicator is removed from the library for some reason, go to the end of the article and download it.
Then it is enough to place this file in the appropriate folder of the terminal data directory, namely in the indicators folder.
After you refresh the terminal in the navigator panel or restart the platform, VolatilityAverageSingleHighLimit will appear in the list of indicators. To use the tool, simply drag its name onto the currency pair chart.
Operating principle. Decoding the received data
As you may have already understood, the volatility indicator is not a signaling tool, so it simply cannot indicate an entry point, since when volatility increases, the line will rise, and when it falls, it will fall.
Once applied to the chart, you'll see three lines: red, yellow, and blue. Each line is actually an ATR line with a different period. The red line represents current volatility, the blue line represents average volatility, and the yellow line represents elevated average volatility.
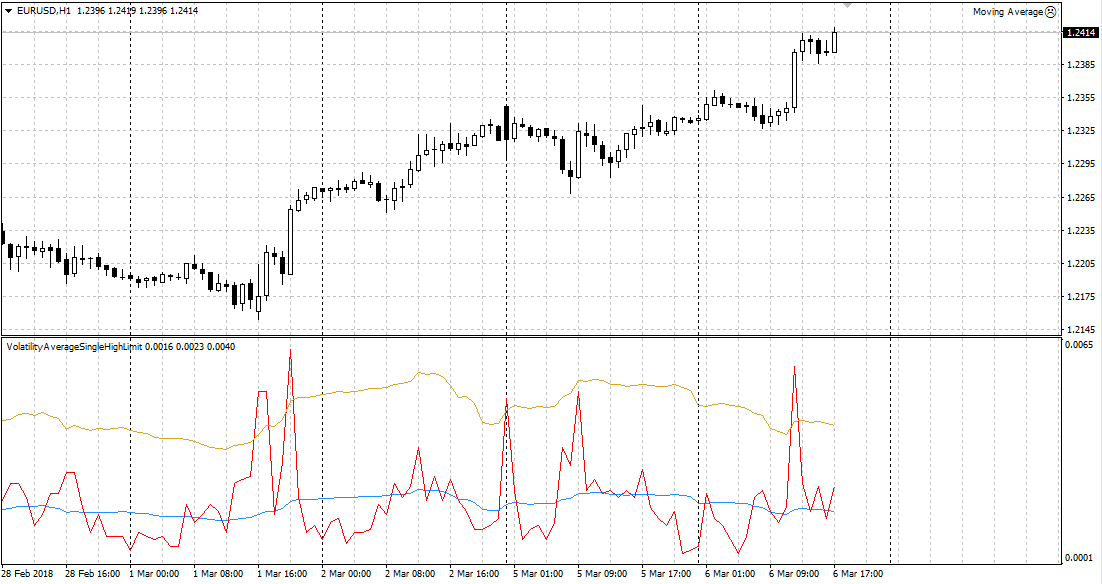
To evaluate the market, you need to compare the location of the red line relative to the blue and yellow lines.
So, if the red line is above the blue line, the market is active. If the red line is above the yellow line, the market is experiencing strong activity, while a red line below the blue line indicates a sluggish market, accumulation, or flat trading.
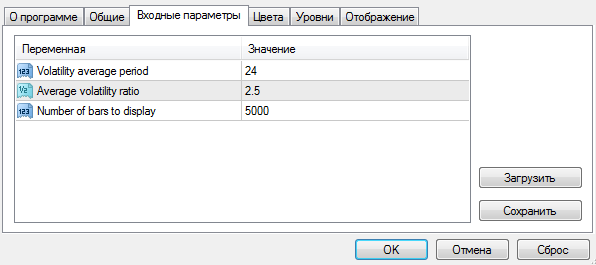
The settings contain a number of simple variables that will allow you to customize the indicator to suit your needs.
So, in the Volatility average period line, you can specify the period of the average volatility value, which we can see on the chart as a blue line.
The Average volatility ratio variable allows you to set the multiplication factor for calculating the line of increased average volatility, namely the one that can be seen on the chart in yellow.
The Number of bars to display variable allows you to set the number of history bars on which the indicator will be displayed (you can reduce the value if the platform starts to slow down).
In conclusion, it is worth noting that VolatilityAverageSingleHighLimit is a highly effective volatility indicator, making it a great filter for any strategy!
Download a high-performance volatility indicator.
Additionally, download the volatility script - http://time-forex.com/skripty/skr-volotilnost

