Chaikin oscillator
The Chaikin indicator is based on such a popular tool as MACD, the main changes affected not only the appearance, but also some of its functional features.
 Now this script also includes the "A/D" script.
The coordinated work of two popular instruments allows for the most accurate analysis of the existing Forex trend.
Ideal for traders using trend-following strategies, it has simple setup and accurate readings, and can work with various currency pairs and on any timeframe.
This is why the oscillator has managed to gain quite a high level of popularity among the majority of Forex traders.
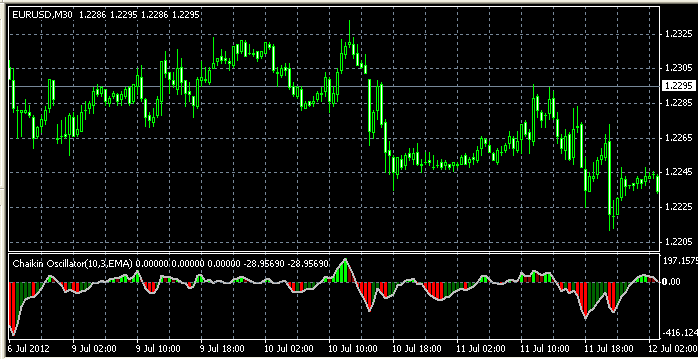
All the obtained trend analysis results can be seen in a separate window of the trading terminal; they are represented by A/D lines and oscillogram bars.
Comprehensive work significantly increases the achieved effect and makes it possible to immediately identify false signals.
Chaikin indicator (oscillator) performance
To characterize a trend, several indicators are used at once, the main ones being:
• Accumulation – Distribution line – it shows the direction of the main trend over a certain time period.
• Chaikin indicator bars – their length increases when the existing trend strengthens, and shortens when the possibility of a trend reversal arises.
In addition, the color changes: green shows movement in the direction of the trend, and red shows a trend correction.
• Zero line – serves as a reference point by which you can determine how great the possibility of a reversal is; it is recommended to open positions when the price just starts to move away from this line.
The Chaikin Oscillator is an excellent tool for use in trend-following trading strategies; its use makes Forex trading more effective and safer.
The main advantages of the Chaikin indicator
Here are some benefits of using the Chaikin Oscillator:
Trend Direction Determination – helps determine the direction of the current trend. Positive oscillator values indicate a bullish trend (rising prices), while negative values indicate a bearish trend.
Overbought and Oversold Identification - Allows you to determine when asset prices are becoming overbought or oversold.
Flexibility: The Chaikin Oscillator can be applied to any financial instrument, including stocks, futures, currencies, and others. This makes it a versatile tool for traders and investors across a variety of markets.
Ease of use - the script is presented in the form of a histogram, which makes it easy to understand and interpret.
It's important to note that, like any other indicator, the Chaikin Oscillator isn't perfect and can generate false signals. Therefore, it's best to combine it with other indicators and analysis methods to make more informed market decisions.

